
Global stock markets have entered a period of heightened volatility following President Trump’s sweeping tariff announcements in early April. These policy shifts—ranging from sector-specific levies to sweeping reciprocal tariffs—have triggered sharp moves across major equity indices.
From Wall Street to Asia-Pacific and Europe, investors are recalibrating risk as trade tensions cloud the global economic outlook. These developments underscore the importance of understanding how geopolitical shifts—such as tariff policies—can influence market sentiment, capital flows, and asset prices.
Below, we explore how eight major stock indices have reacted to the volatility triggered by Trump’s tariffs.
Index 1: S&P 500 (US)
This index tracks the value of 500 leading companies in the US. It is widely regarded as the benchmark index on Wall Street and the best single gauge of large-cap US equities. The index covers roughly 80% of available market capitalisation and is market-cap weighted. In recent years, the S&P 500 has been dominated by several megacap technology companies like Apple, Nvidia and Microsoft, which have individually topped the $2-3 trillion market cap mark.
How was it affected by the tariff?
The index fell sharply on the three days following President Trump’s “Liberation Day” announcement. The tariffs press conference outside the White House was deemed to be worse than the worst-case scenario. At one point, the S&P 500 had fallen over 13% across that time, before prices bounced strongly higher a week later when Trump’s reciprocal tariffs were walked back. The benchmark index enjoyed its biggest intraday point gain on record and largest percentage gain since October 2008. But the continued uncertainty has seen selling in recent days.
Chart Overview and Analysis
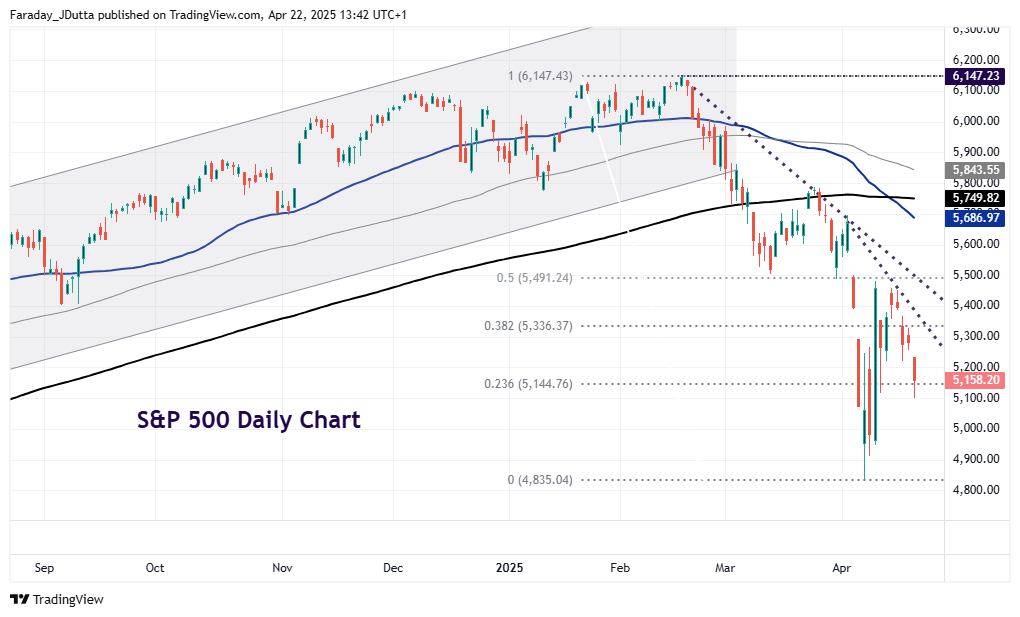
The rebound from the sharp early April sell-off didn’t quite make it to the halfway point of the decline from the record high in mid-February to the spike low on Monday, 7 April, at 5,491. Prices showed declines over the last few days as they have hit a short-term negative trendline, which now acts as initial resistance around 5,300.
The 50-day simple moving average has crossed down through the 200-day simple moving average which indicates a “death cross” – a bearish signal. The psychological 5,000 mark could act as some support but the year-to-date and April bottom at 4,835 is key.
Index 2: Dow Jones (US)
The Dow Jones Industrial Average, Dow Jones, or simply the Dow measures the value of 30 major blue-chip stocks in the US. The index is one of the oldest and most commonly followed equity indices, even though it only tracks a small number of the biggest US companies. Household names included in the index include Apple, Nike and Disney. The index is price-weighted and traditionally had an industrial sector bias.
How was it affected by the tariff?
The Dow followed very similar price action to the other major US indices. Prices plunged over the following days after President Trump’s initial baseline and reciprocal tariff announcements. An intraday spike low during the early hours of the next week saw a bounce back and then a massive single day of buying when Trump rolled back most of his tariffs. In recent sessions since mid-April, the index has turned lower on huge uncertainty about what happens next.
Chart Overview and Analysis
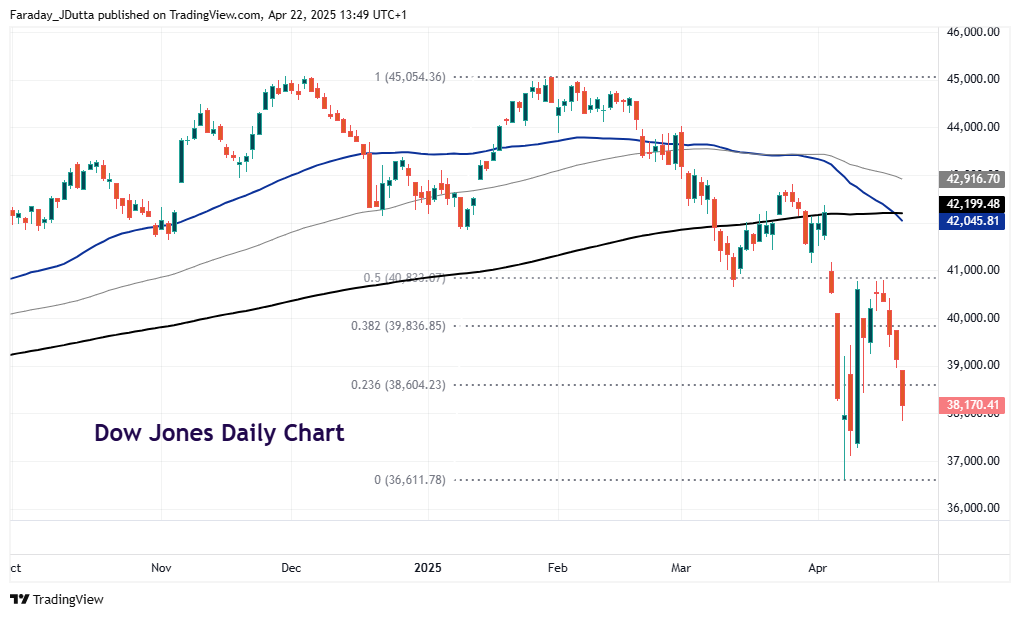
The Dow has sold off recently, after finding resistance at the 50% retracement level of the downtrend from the record high to the recent spike low at 40,833. A “death cross” is also in play, similar to the other US stock indices – that is where the 50-day simple moving average crosses down below the longer-term 200-day moving average. Resistance resides at the major Fib level (38.2%) of this year’s downtrend at 39,836. The recent bottom is at 36,611.
Index 3: Nasdaq (US)
The Nasdaq index is made up of around 3,500 companies. These have a heavy weighting towards firms in the technology and other growth-orientated sectors. Well-known names on this index include Netflix, Tesla and eBay, and it is market-cap weighted. The Nasdaq 100 focuses on the 100 biggest non-financial companies on the Nasdaq.
How was it affected by the Tariff?
Similar to the other indices on Wall Street, the Nasdaq collapsed after the Liberation Day announcement, before rebounding strongly. The day of buying on Wednesday, 9th April, due to Trump’s tariff pause revelation, was the second biggest gain ever seen in one day. Huge volatility was initially caused by crowded positioning with investors invested in a narrow breadth of companies, while stretched valuations caused investors to exit quickly for cheaper alternatives.
Chart Overview and Analysis
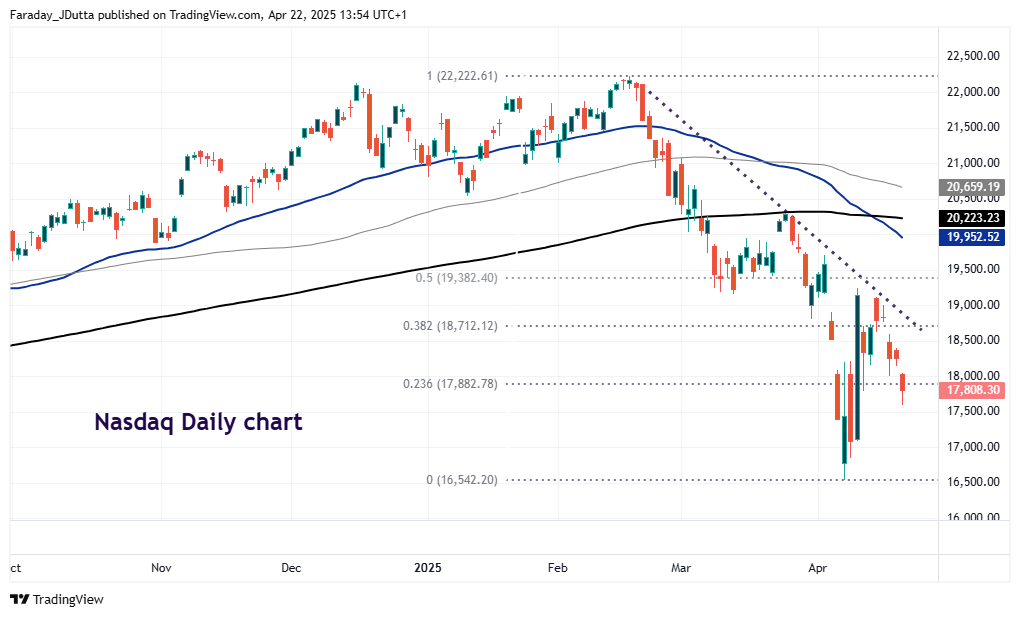
The tech-heavy Nasdaq index saw resistance at the negative down trendline just below 19,200. Selling has been seen in recent days with prices falling down through a minor Fib retracement level (23.6%) of the February to April fall at 17,882.
A “death cross” has formed which means short-term price action is worse than long-term price action. That said, there are plenty of examples of brief pauses with rallies continuing over the longer-term. The recent low is 16,542 with resistance just below 18,800.
Index 4: Nikkei 225 (Japan)
The Nikkei 225 is the leading stock market index for the Japanese stock exchange in Tokyo. It is made up of 225 of the most prominent listed companies in Japan and is modestly skewed towards technology companies. Recognised names on the Nikkei include Mitsubishi, Sony and Toyota.
How was it affected by the Tariff? (Initial tariff 24%, current 10% + 25% on autos)
Looking relatively weak just before the announcements of tariffs, the index plunged over the next few days. President Trump hit Japan with 24% tariffs on its exports, while it was not exempt from a 25% duty on all automobile imports in the US, a mainstay of Japan’s export-heavy economy.
But the subsequent, second week of April saw buying and a major rebound again exactly a week after the initial Trump proclamation and ensuing pause of reciprocal tariffs. Prices have appeared to hold up relatively better than other major stock indices, with Japan expected to be at the front of the queue in negotiating a trade deal with the Trump administration.
Chart Overview and Analysis
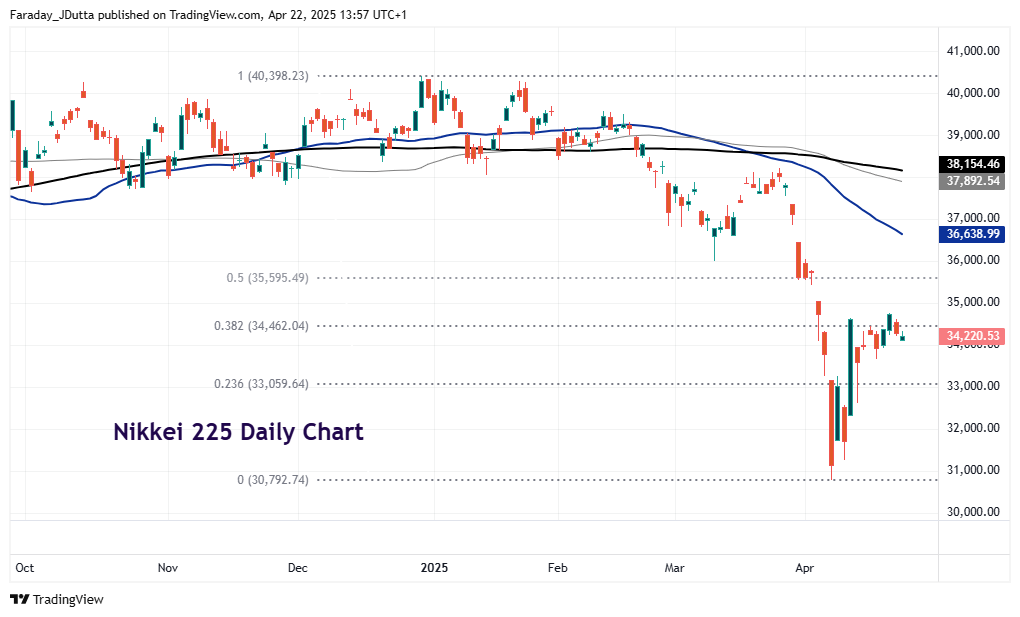
The liquidation low on 7 April at 30,792 beat the August 2024 spike trough at 31,156, but this marks a zone of support. Prices have rebounded to a major Fib retracement level (38.2%) of the December to April decline at 34,462.
Above here is the midpoint of that move at 35,595. Below, sits a minor retrace mark (23.6%) at 33,059, ahead of that major support zone around 31,000.
Index 5: Hang Seng Index
The Hang Seng is a stock market index based in Hong Kong. Due to Hong Kong’s status as a special administrative region of China, there are close ties between the two economies. That means many Chinese companies are listed on the Hang Seng. Household names included and traded on the index include HSBC and Alibaba.
How was it affected by the Tariff? (Average current tariff 124%)
The Hang Seng gapped sharply lower after the announcement of reciprocal and universal tariffs, falling over 13.2% on 7 April, its worst single day drop since 2008. Asian economies were particularly sensitive to fears that a global trade war could trigger a slowdown or even a recession in the US, the world’s biggest economy.
That, in turn, would further hurt Asian exports. Slumps in mainland China, Hong Kong and Taiwan were exacerbated as investors caught up with the big falls seen in other markets on Friday, as they were closed for public holidays. Similar to other major stock indices, the Hang Seng bounced back on the pause announcement, though even more levies on China were proclaimed by President Trump. Share buybacks and stock buying by state-backed investors helped steady the market.
Chart Overview and Analysis
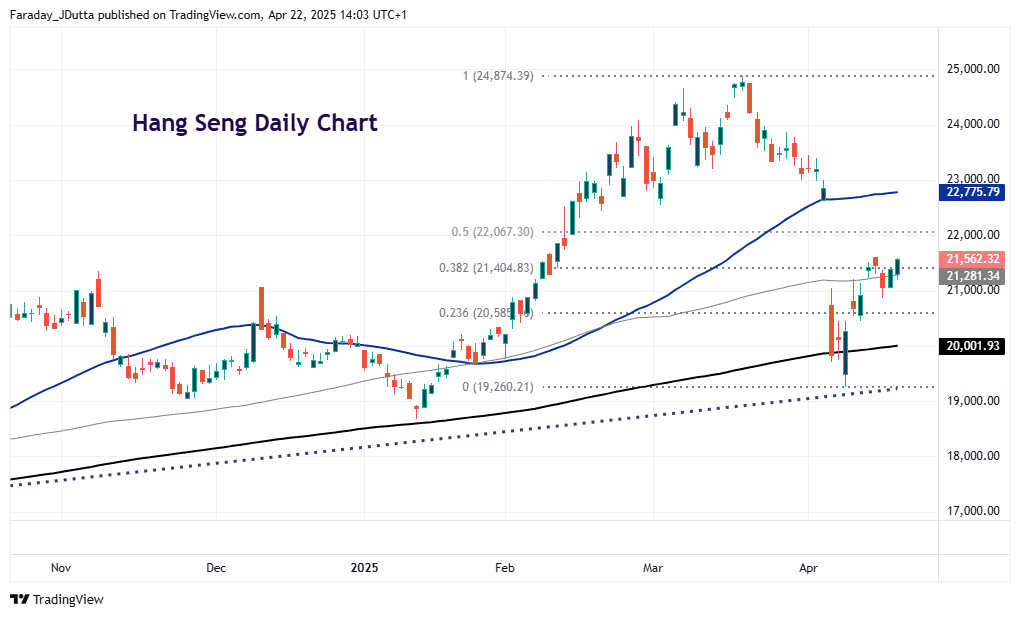
After a huge classic capitulation day and 13.2% sell-off on 7 April, prices traded around the 200-day simple moving average after posting a low at 19,260. A long-term upward trendline from the 2024 low resides just below that bottom.
The rebound since has moved up to a major Fib retracement level (38.2%) of the March to April decline at 21,404. The 100-day simple moving average sits at 21,281. The next upside target is the halfway point of that move at 22,067.
Index 6: DAX 40 (Germany)
The Dax 40 is the most important stock market index in Germany. It is made up of 40 of the most important companies in the country. Well-known names traded on the index include Adidas, Volkswagen and Deutsche Bank. The Dax is weighted by market capitalisation and has been dominated in recent years by a handful of companies like SAP, Siemens and Deutsche Telekom.
How was it affected by the Tariff? (Initial tariff 20%, current 10% + 25% on steel, aluminium, autos)
Across the entire week which included “Liberation Day”, Germany’s leading stock index plummeted by more than 8%, the biggest weekly fall since Russia launched its full-scale invasion of Ukraine in the spring of 2022. It was assumed that Germany’s export-based economy would be hit particularly hard by the new measures. The Dax has rebounded from the low on 7 April, with the pause proclamation helping risk sentiment. But prices haven’t gotten back to levels seen before the initial early April announcements.
Chart Overview and Analysis
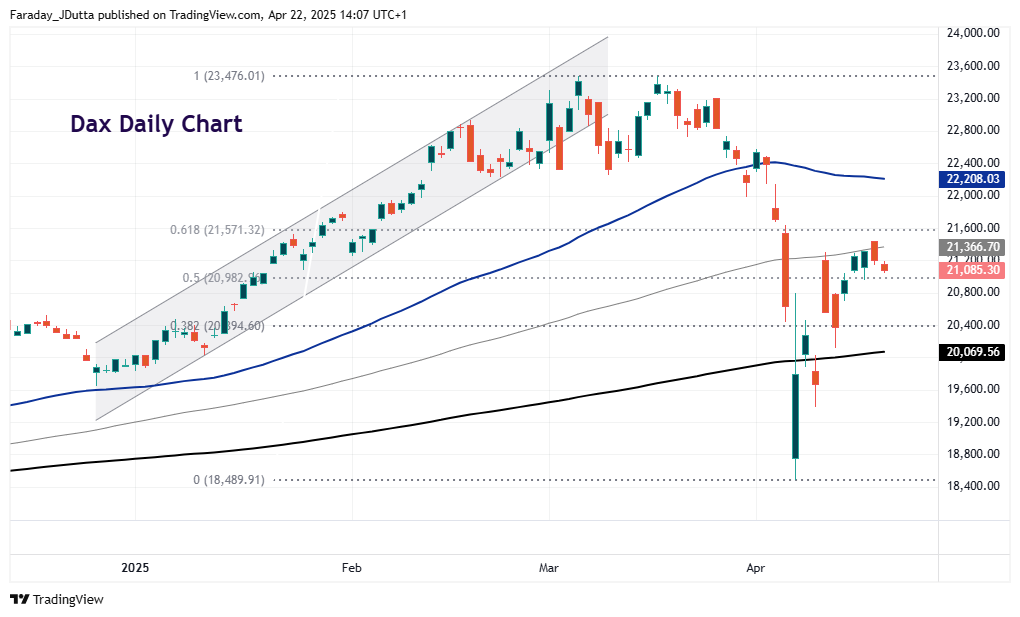
The main German equity index dropped close to 10% in two days on Friday 4 April and Monday 7 April. Prices moved down below the 200-day simple moving average, which now stands at 20,069. The low at 18,489 was a level last seen in September 2024.
Since then, the rebound has moved back up to the 100-day simple moving average around 21,366. At the time of writing, The index sits just above a retracement mark (50%) of the March to April plunge at 20,982. The next upside target is a major Fib level (38.2%) at 21,571.
Index 7: FTSE 100 (UK)
The FTSE100 is the major stock market index of the UK which is traded at the London Stock Exchange. It comprises the 100 largest UK companies by value, including well-known firms like Barclays, Rolls-Royce and Rio Tinto. A lot of these businesses derive their revenues from outside of the UK, while the index contains fewer big technology companies, in contrast to some of the major US stock indices.
How was it affected by the Tariff? (Initial tariff 10%, current 10% + 25% on autos)
The FTSE100 suffered back-to-back 4%+ falls after President Trump announced his tariffs and levies on trading partners in early April. It posted its lowest closing level in a year, just five weeks after hitting a record high over 8,900. The UK’s main stock market bounced back well as tariffs have been walked back, with six consecutive days of gains. The UK is believed to be in a relatively strong position to do a trade deal with the US, with talks at an advanced stage to secure agreement.
Chart Overview and Analysis
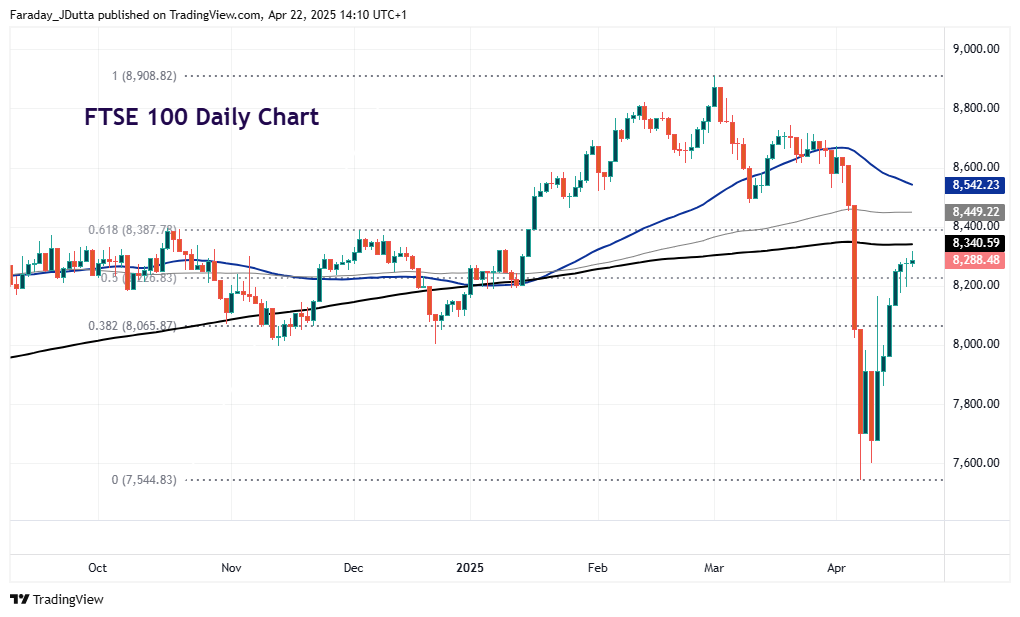
The three-day crash took the FTSE 100 back to levels last seen in mid-February 2024 at 7,544. Prices were volatile above here and below 8,000 for a few days before a more decisive rebound took place with seven days of consecutive buying.
The index is now above the midpoint of the March to April plunge at 8,226. The 200-day simple moving average sits above here as resistance at 8,340, with the next major Fib retracement level (61.8%) at 8,387.
Index 8: ASX (AU)
The ASX 200 is recognised as the major benchmark index in Australia due to it being representative, liquid and tradable. It includes the 200 largest index-eligible stocks listed on the ASX by market cap, comprising companies like Westpac Banking and BHP. The index was created in 2000 and covers more than 80% of the entire Australian stock market by size.
How was it affected by the Tariff? (Initial tariff 10%, current 10% + 25% on autos)
The ASX 200 collapsed in the couple of days after President Trump’s first announcement in the rose garden in the White House. But those declines were rapidly pared back with a 6.6% rebound when the tariff pause was declared. Prices have recovered toward to levels seen around the time of “Liberation Day” so have performed relatively well. Of course, the unpredictability of US trade policy is likely to have ongoing impacts on investment and trade, as companies and consumers wait for clarity.
Chart Overview and Analysis
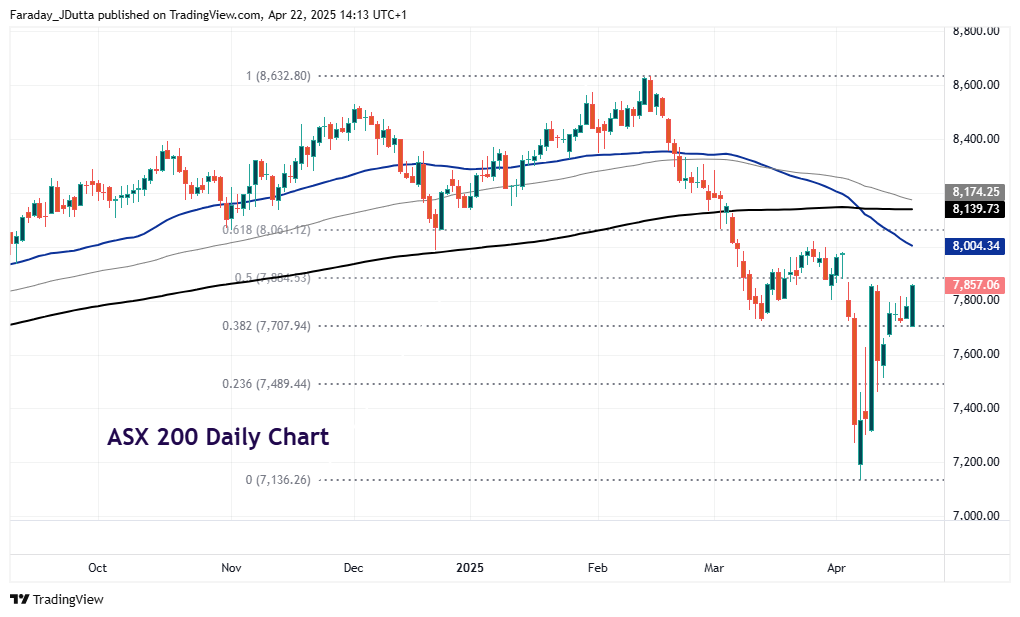
Choppy recent price action has seen the index hover just above support at a major Fib retracement (38.2%) of the February to April decline at 7,707. The 50% point of that move sits above at 7,884, with the 50-day simple moving average at 8,004. Initial support below is the August spike low at 7,519 and then a minor Fib level at 7,489.
Conclusion
Tariffs are a moving target, which means markets have been on a wild ride since President Trump’s early April announcements. With high uncertainty surrounding future trade decisions and policies, stock markets are walking a tightrope.
A slowdown in growth and activity is expected, which means valuations may get lowered and earnings revised down. Many Wall Street analysts forecast a re-test of the recent lows.
Open a live trading account with Vantage today to receive real-time updates on global indices, tariff-related market developments. Stay informed with insights from our comprehensive market coverage of Trump’s latest tariff moves.
Disclaimer: The information is provided for educational purposes only and doesn’t take into account your personal objectives, financial circumstances, or needs. It does not constitute investment advice. We encourage you to seek independent advice if necessary. The information has not been prepared in accordance with legal requirements designed to promote the independence of investment research. No representation or warranty is given as to the accuracy or completeness of any information contained within. This material may contain historical or past performance figures and should not be relied on. Furthermore estimates, forward-looking statements, and forecasts cannot be guaranteed. The information on this site and the products and services offered are not intended for distribution to any person in any country or jurisdiction where such distribution or use would be contrary to local law or regulation.