Inflation Bubbling Over: What U.S. Core CPI Means for Markets?

Inflation is a hot-button topic in financial markets, especially with Trump’s wild policy swings and tariffs stirring up concern and volatility. Traders are closely watching the upcoming US Core CPI data, which offers a glimpse into how inflation might pick up after Liberation Day when Trump’s tariff tantrum started to kick in.
The Core Consumer Price Index (Core CPI) measures the change in prices of goods and services excluding food and energy, which are known to be volatile components. This metric offers a clearer view of underlying inflation trends, making it a critical indicator the Fed closely watches when deciding on monetary policy. For traders, Core CPI is a barometer for potential interest rate changes that have wider market implications.
What is Happening with the US Core CPI?
March data showed that the US Core CPI rose by 0.1% month-over-month, marking the smallest increase in nine months. On a year-over-year basis, it increased by 2.8%, the lowest since March 2021. This deceleration suggests that inflationary pressures may be easing. However, this could all be a moot point after Liberation Day on 2 April, which introduced fresh inflationary risks, with most of the impact expected to be felt in Q2 2025.
A higher Core CPI reading could weigh on the US dollar, as it signals an uptick in inflation at a time when tariffs are denting economic growth, leaving the Fed with little room to cut interest rates. In contrast, a softer inflation print may ease stagflation concerns, pave the way for Fed rate cuts, and support the economy, providing a short-term lift for the US dollar.
USDJPY Wobbles as Traders Weigh Inflation Risks Against Progress on Trade Deals
USDJPY is stalling below resistance at 150.80 despite a lift from a better-than-expected US-China deal to temporarily slash tariffs, which helped ease recession fears and boosted the US dollar. Under the deal, the US will reduce its tariffs on Chinese goods from 145% to 30%, while China will lower its retaliatory duties from 125% to 10% for 90 days.
This partial easing of trade tensions has helped calm recession fears and lifted sentiment across risk assets, but markets remain cautious ahead of the US Core CPI report. A resurgence in inflation keeps the Fed’s hands tied just as tariffs weigh on growth, keeping the US dollar on shaky ground.
Ticker: USDJPY, Timeframe: Daily
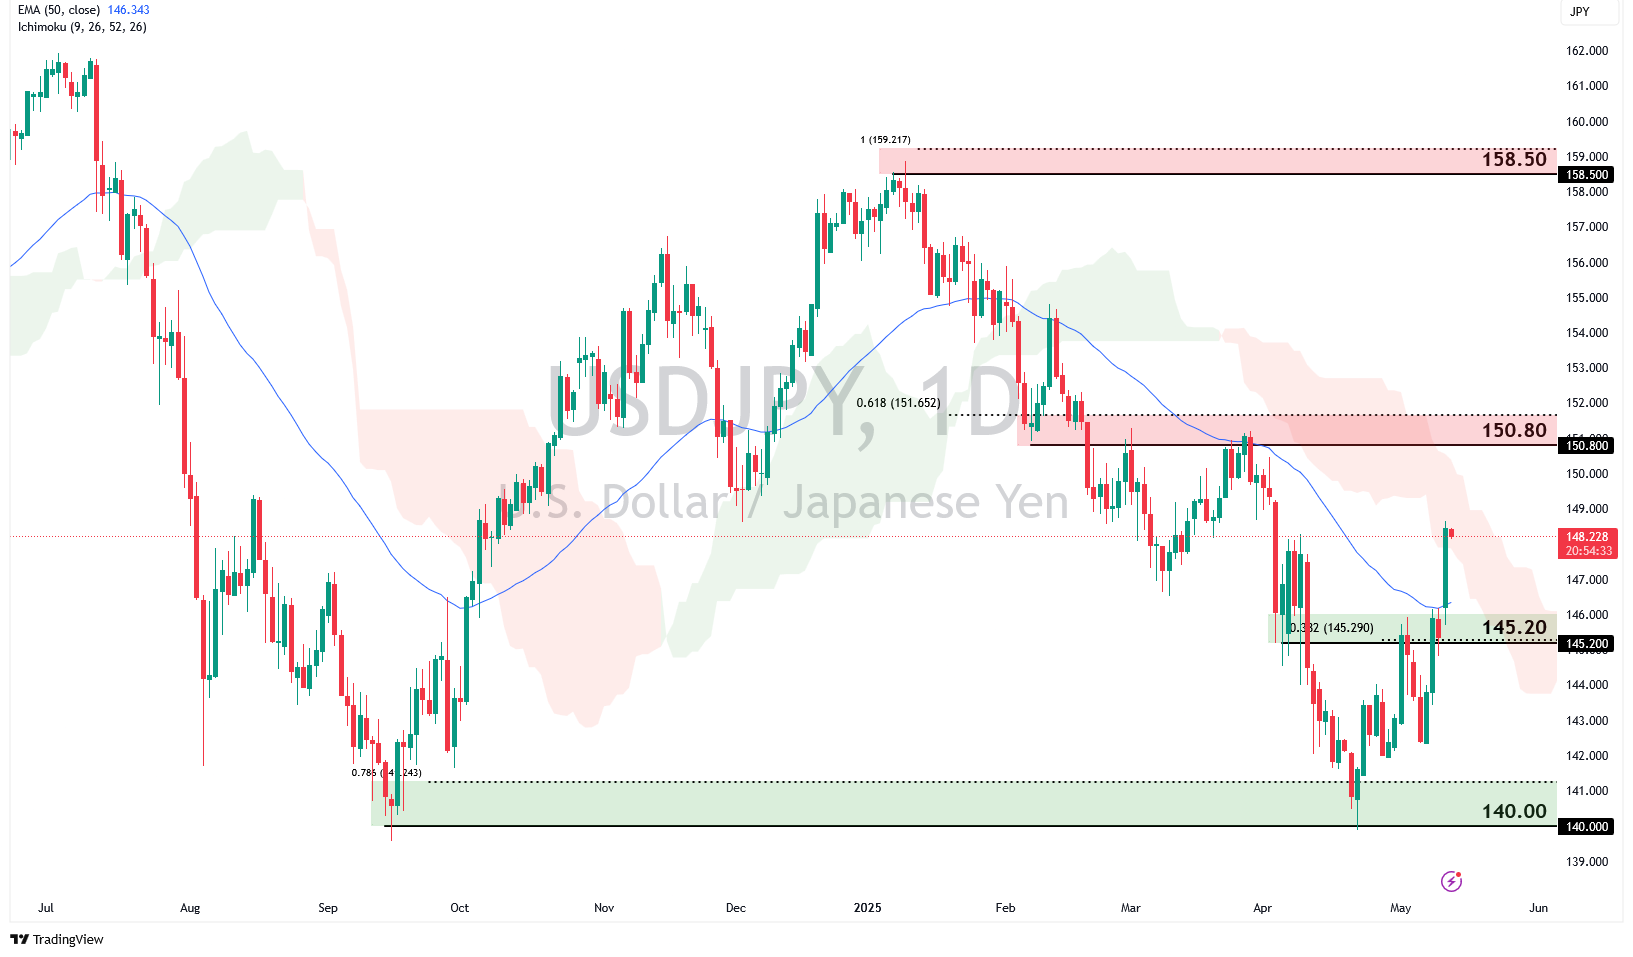
USDJPY holds below the 150.80 key resistance zone, which is in line with the Ichimoku Cloud and previous swing high. Price has recently bounced off the 145.20 support area, which coincides with the 50-day EMA and prior consolidation range. A sustained move above this level could prompt a retest of the 150.80 resistance. However, failure to hold above 145.20 support could trigger a decline towards the subsequent support at 140.00, which coincides with the 78.6% Fibonacci Extension.
EURUSD Slips as Trump Dials Down China Tariffs and Trains Sights on EU
EURUSD pared recent gains and slipped below 1.1200 as markets reassessed the pace of US-EU trade negotiations. Trump’s sharp rhetoric, calling the European Union (EU) “nastier than China” and threatening higher drug prices for the bloc, underscored rising transatlantic tensions. This contrast reinforced perceptions that the EU is lagging in securing favourable trade terms, dampening the Euro.
Ticker: EURUSD, Timeframe: Daily
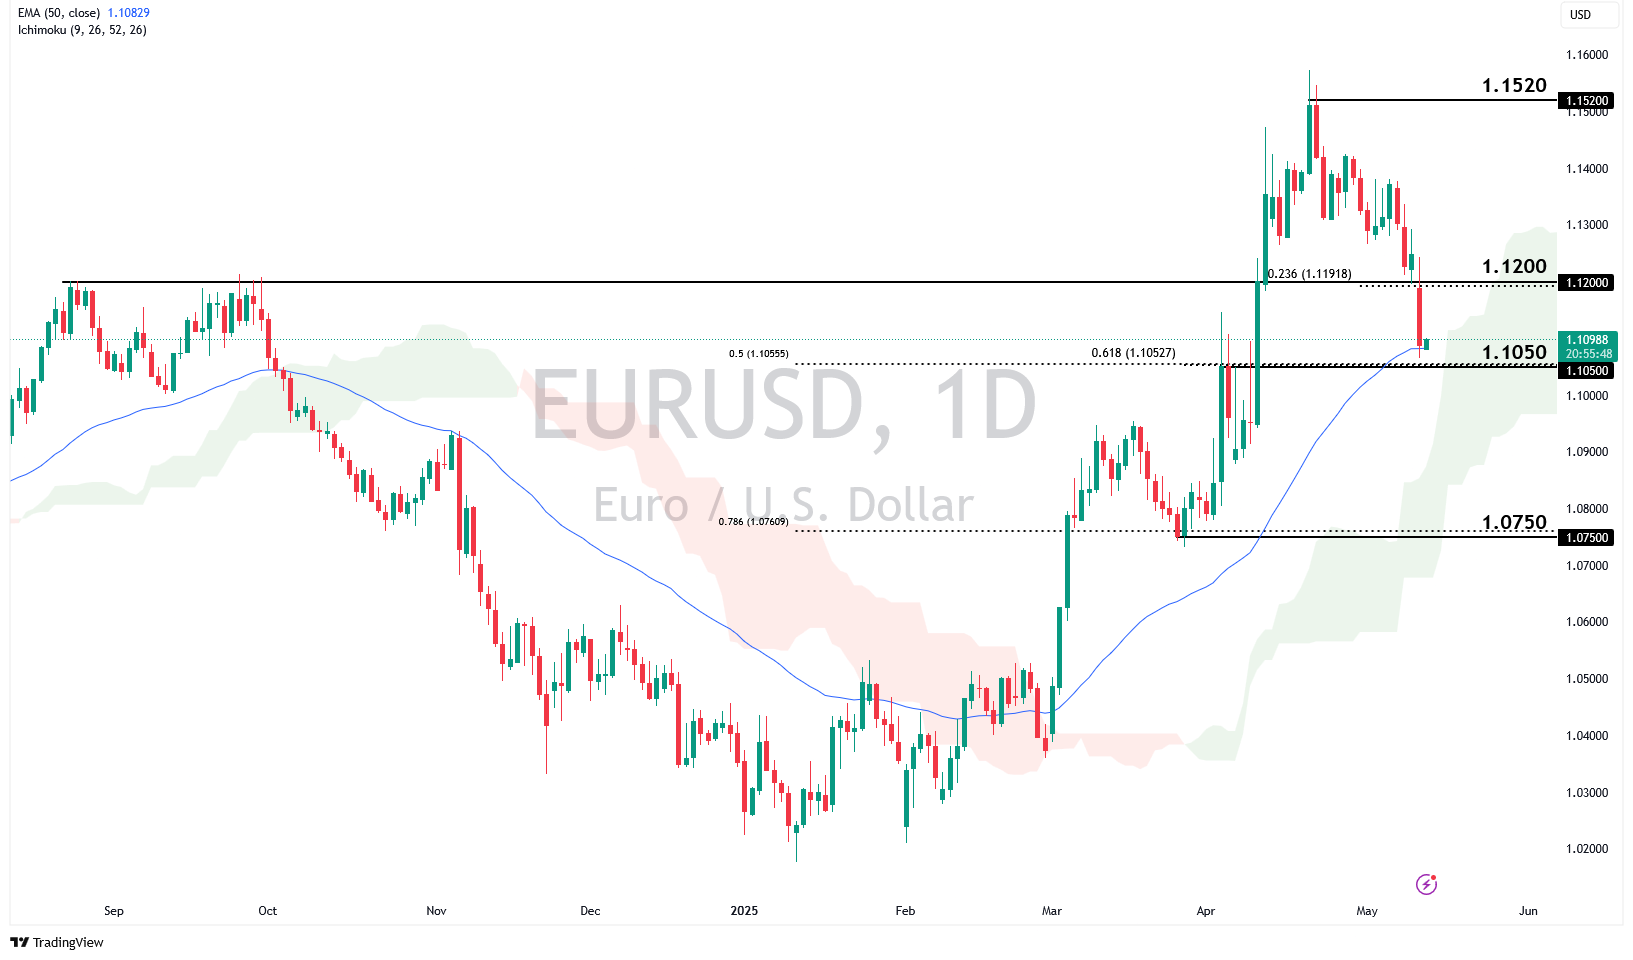
EURUSD currently hovers above the 1.1050 support zone, which aligns with the 50% and 61.8% Fibonacci Retracement. The price is also trading above the 50-day EMA and Ichimoku Cloud suggesting the potential for a bounce above 1.1050. However, it is worth noting that the pair has retraced from its recent peak near 1.1520.
If EURUSD regains bullish momentum above the 1.1050 support, a renewed push toward the 1.1200 resistance could be seen. A decisive break above this level could lead to a retest of the major resistance at 1.1520. However, should the price fail to sustain above 1.1050, it could suggest a deeper correction towards the next support at 1.0750, which aligns with the 78.6% Fibonacci Retracement.
Traders should continue to keep a close eye on core CPI and other inflation data as the aftermath of Trump’s tariff policies looms large. For now, stay nimble and ready to adjust strategies in response to any surprises in inflation data, while keeping a close eye on trade developments that could shift the narrative. The stakes are high, but the rewards for those who navigate this volatility effectively could be significant.