-
AllTradingPlatformsAcademyAnalysisAbout
-
Keywords
- Trading Accounts
- TradingView
- Trading Fees
Popular Search
- Trading Accounts
- MT4
- MT5
- Professional Trading Accounts
- Academy
Popular CFD Trading Strategies
Different strategies suit different traders depending on individual goals, market conditions, and risk tolerance. In this section, we explore some of the most commonly used CFD trading strategies by Australian traders today.
1. Trend Following Strategy
The trend following strategy is popular among traders who prefer to ride the momentum of established market movements rather than predicting reversals.
What Is Trend Following, Exactly?
Trend following is based on the idea that "the trend is your friend." Traders aim to enter positions in the direction of the prevailing market trend—upward or downward—once it has been clearly established.
How to Use Trend Following
Here are four tips on how to use trend following as part of your trading strategy:
- Confirm the trend direction using tools like moving averages or trendlines.
- Enter a long position in an uptrend (i.e., higher highs and higher lows).
- Enter a short position in a downtrend (i.e., lower highs and lower lows).
- Avoid early entries to reduce the risk of false signals.
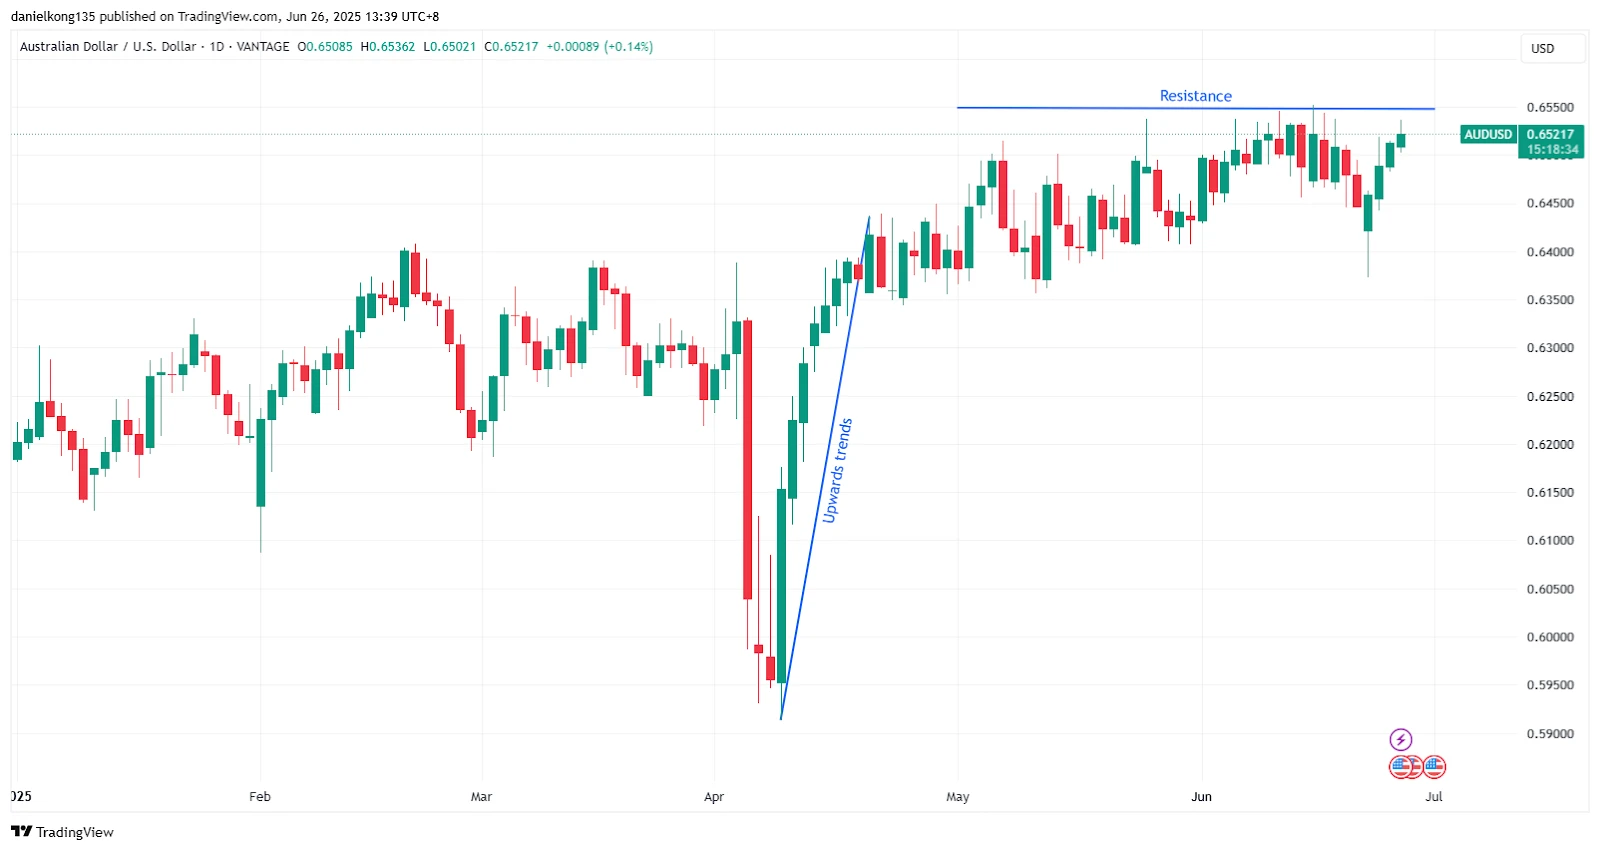
Example: AUD/USD Chart (Year to date)

Chart 1: AUD/USD price chart year to date for 2025. Source:
https://www.tradingview.com/x/tv9I0Pcf/
The Australian Dollar (AUD) against the US Dollar (USD) is showing signs of a medium-term uptrend, particularly from mid-April 2025 onwards. After a sharp correction in late March, the pair rebounded strongly, forming a series of higher lows and higher highs — a key signal for trend followers.
This upward structure remains intact, with price recently approaching resistance near the 0.6550 zone. As of June 26, 2025, the pair is trading around 0.6524, attempting to break above recent consolidation levels.
For a trend-following approach, traders may observe:
- Pullbacks to prior support zones (e.g., 0.6450 and 0.6400) as potential re-entry opportunities.
- Continuation signals such as bullish candlestick patterns or moving average crossovers.
- Momentum confirmation using tools like the ADX or MACD to validate trend strength.
The overall bias remains bullish while price action stays above the 0.6400–0.6450 support area.
Read this Trend Analysis Guide to learn more!
Risk Reminder:
Trend following strategies work well in trending markets but can result in losses in volatile or choppy markets. Patience and discipline are key.
2. Breakout Trading Strategy
What is Breakout Trading?
Breakout trading involves identifying key levels of support or resistance and entering a trade when the price breaks out of these levels, signalling the start of a strong trend.
How to Use Breakout Trading?
- Identify significant support or resistance levels.
- Enter a trade when the price breaks through these levels, either to the upside or downside.
- Confirm breakouts with supporting candlestick patterns, such as bullish or bearish engulfing patterns.
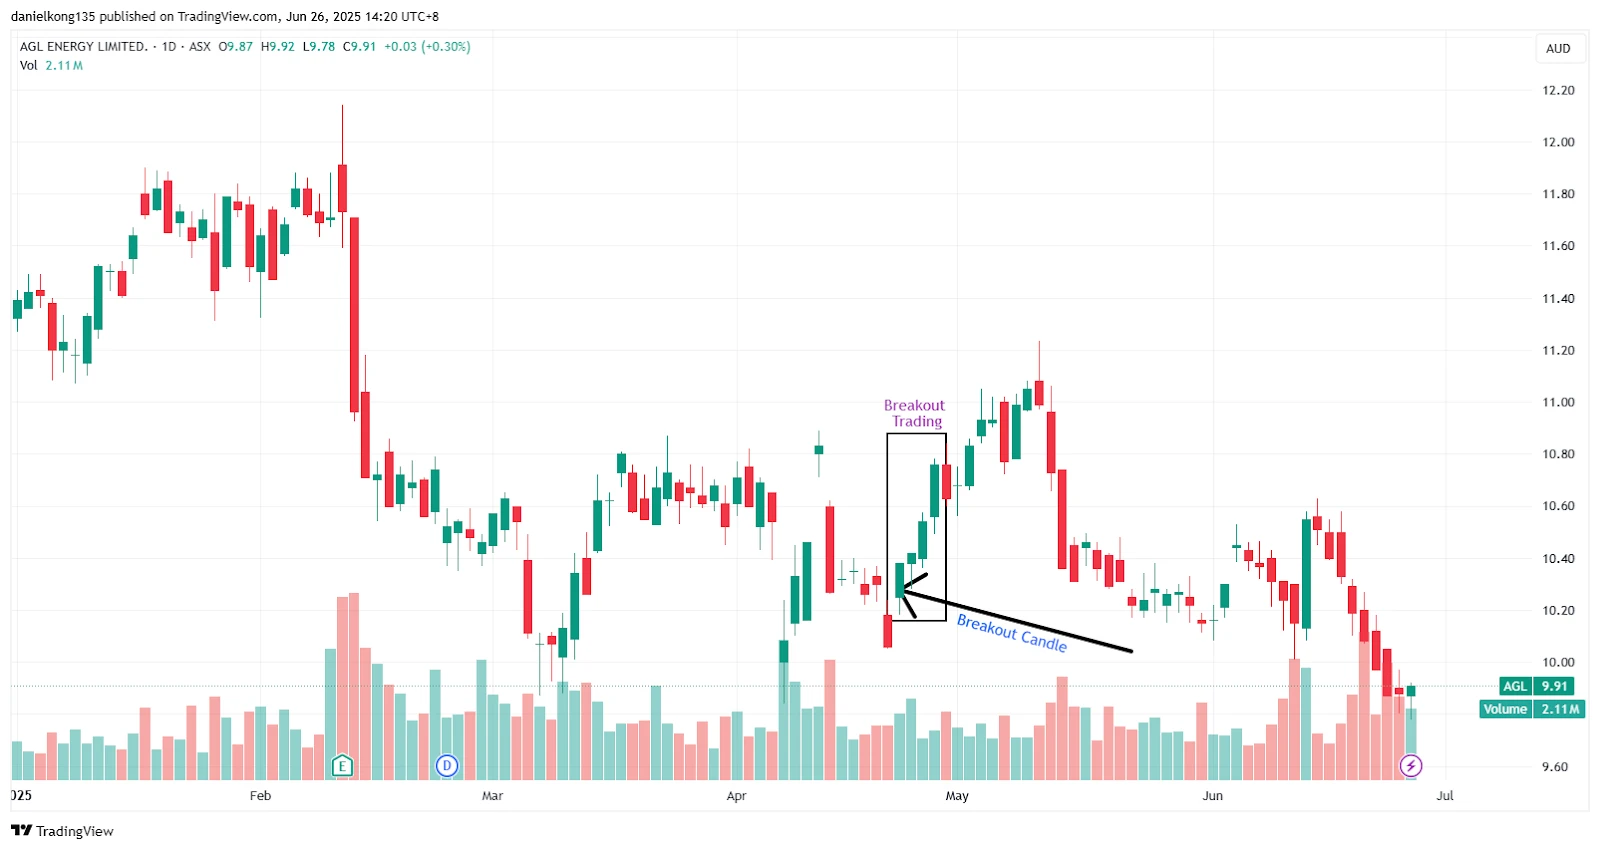
Example: AGL Energy from January to June 2025

Chart 2: AGL Energy daily stock price from January to June 2025. Source:
https://www.tradingview.com/x/mokUesX6/
The daily chart for AGL Energy reveals a classic breakout scenario marked by a consolidation phase followed by a sharp bullish move. From mid-April to late April, price action exhibited tight range-bound movement with limited volatility. This period of low activity is typical of pre-breakout conditions.
The breakout occurred in early May, when the price surged out of the range with strong bullish candles. This momentum-driven move is highlighted in the black box and labelled “Breakout Trading.” Traders often look for such breakouts from a horizontal resistance zone, confirmed by rising volume and bullish follow-through.
Breakout traders may monitor:
- Consolidation ranges: Prior to the breakout, the price was coiling between AUD 9.50 and AUD 9.75.
- Breakout confirmation: A decisive close above the range high (~AUD 9.75) signalled potential entry.
- Risk controls: Stop-loss orders are often placed just below the breakout level or previous swing low.
This setup demonstrates how breakout trading can be employed to capitalise on directional surges after periods of consolidation.
Risk Reminder:
Breakouts can sometimes be false. Confirm breakouts with additional technical indicators to minimize the risk of false signals.
3. Range Trading Strategy
What is Range Trading?
Range trading is ideal for markets that are trading sideways, bouncing between established support and resistance levels. Traders buy near support and sell near resistance, capitalising on price fluctuations within the range.
How to Use Range Trading:
- Identify a market that is not trending and is instead bouncing within a price range.
- Buy when the price approaches support and sell when it approaches resistance.
- Close positions when the price shows signs of a reversal.
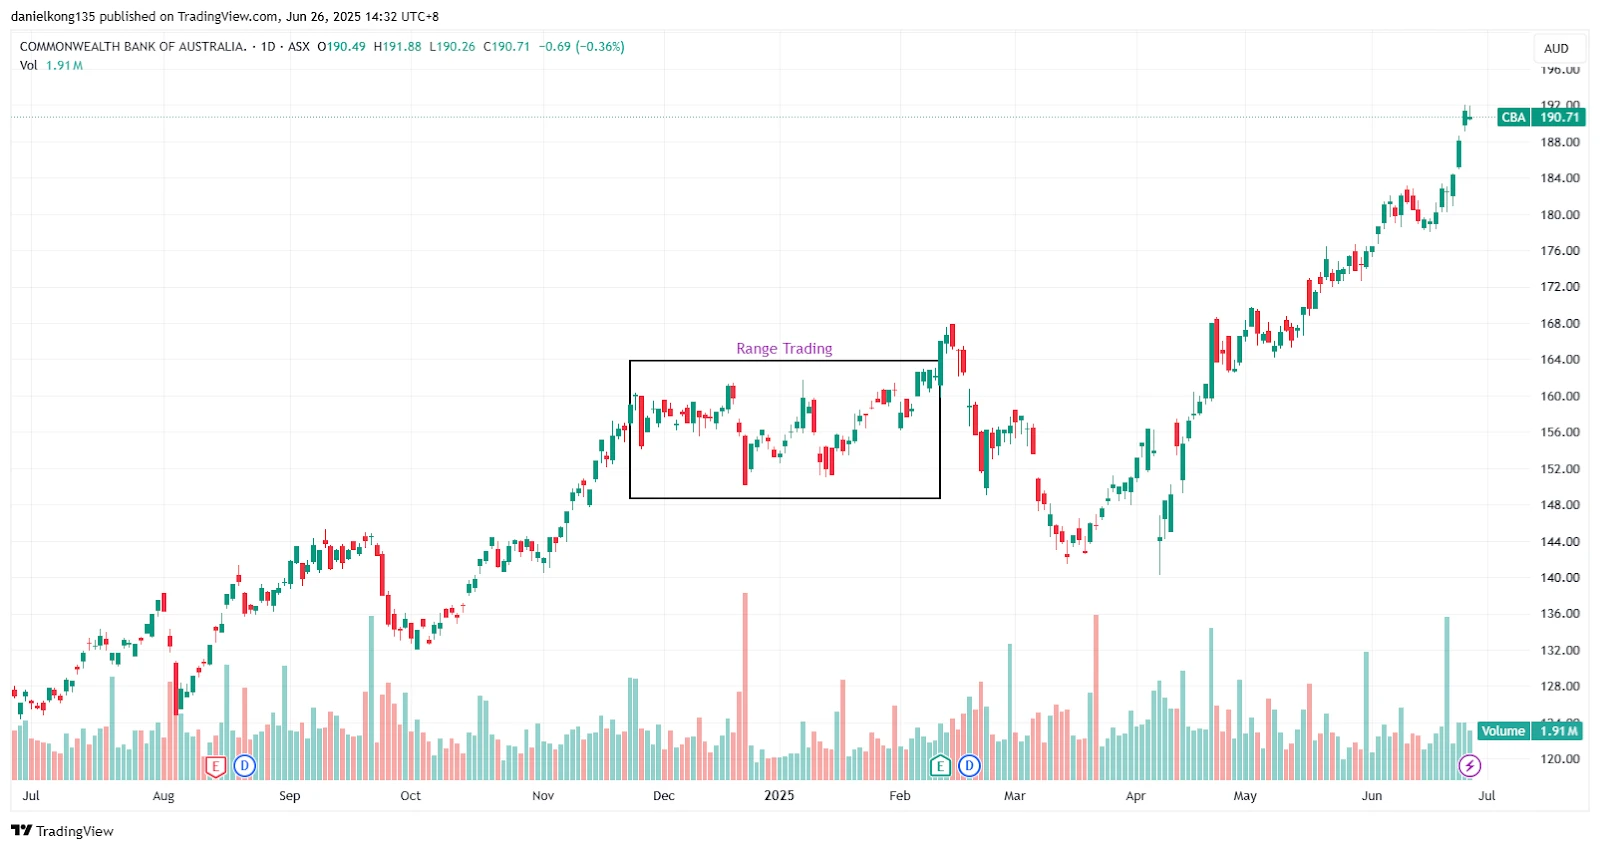
Example: Commonwealth Bank of Australia June 2024 to June 2025

Chart 3: Commonwealth Bank of Australia daily price chart from June 2024 to June 2025. Source:
https://www.tradingview.com/x/enuwNYEW/
The daily chart for CBA highlights a clear range-bound phase between late November 2024 and mid-February 2025. During this period, price repeatedly oscillated between well-defined support and resistance levels, forming a horizontal channel — a classic condition suited to range trading strategies.
Range trading involves identifying price extremes within the range:
- Buying near the support zone, where price has historically rebounded.
- Selling near the resistance level, where price has previously struggled to break higher.
In this case, the lower bound of the range sat near AUD 152, while the upper resistance level was around AUD 162. Price moved between these levels several times, offering multiple entry and exit points within the boxed region labelled "Range Trading."
Volume remained relatively steady throughout, further confirming the sideways structure without any breakout pressure.
Risk Reminder:
Range trading can be ineffective in trending markets, so always ensure the market is truly range-bound before executing trades.
Using Technical Analysis for CFD Trading
Technical analysis plays a key role in CFD trading as it helps traders spot trends, entry and exit points, and anticipate potential price movements by studying price charts and applying various indicators.
1. Identifying Entry and Exit Points
Successful traders understand the importance of timing their enter and exit trades. Identifying the right moments can significantly improve trading outcomes. Technical indicators are often used to pinpoint optimal entry and exit points.
2. Popular technical indicators
Support and resistance levels
Support and resistance are key concepts in price analysis. These levels mark where the price tends to reverse direction due to increased buying or selling pressure.
Moving Averages
Moving averages help smooth out price movements and identify the underlying trend. When combined with other indicators, moving averages can highlight potential entry points.
Relative Strength Index (RSI)
RSI is an oscillator that identifies overbought or oversold conditions in the market. It helps traders spot possible entry points when the price is considered too high or too low.
Interested to know more? This article tells you everything you need to know about the basics of technical analysis.
Fundamental Analysis for CFD Trading in Australia
Fundamental analysis supports CFD traders in understanding market trends by analysing economic indicators. In Australia, monitoring macroeconomic events can uncover valuable trading opportunities. Here's a quick guide on key economic factors that can influence your CFD trades.
1. Corporate Earnings
Corporate earnings reports can cause significant market movements. Positive earnings often lead to price rallies, creating buying opportunities, while poor earnings can lead to sell-offs and open up potential shorting opportunities.
Key Tip:
Track earnings reports of ASX-listed companies to identify potential market movements.
2. Interest rates and the RBA
Interest rates set by the Reserve Bank of Australia (RBA) have a major influence on market sentiment. Rate hikes can slow economic growth, while rate cuts tend to boost stock prices and economic activity.
Key Tip:
Watch RBA announcements closely, as they can drive movements in the Australian Dollar (AUD) and domestic equities.
3. Inflation:
Inflation is closely tied to interest rate decisions. Rising inflation can lead to higher rates, which can dampen market growth, while low inflation supports more stable economic conditions.
Key Tip:
Follow Australian inflation reports, like the CPI, to anticipate potential market shifts.
4. Household Consumption and Confidence
Consumer spending drives demand for goods and services. Increased spending can lead to higher stock prices, particularly in retail and commodity sectors.
Key Tip:
Monitor Australian consumer confidence and retail sales data to gauge overall economic health and market sentiment.
5. Trade Tariffs and Global Trade
Changes in trade policies or tariffs can disrupt markets, particularly for Australian exporters. Trade agreements or tariffs can influence the price of both commodities and stocks.
Key Tip:
Stay informed on trade negotiations affecting Australian industries, particularly agriculture and mining.
Risk management in CFD trading
CFD trading involves risk, particularly when using leverage. Effective risk management is essential for protecting your capital. In Australia, it’s important to understand the risks involved and have clear risk management strategies in place to manage them.
Stop Loss and Take Profit Orders
Stop-loss and take-profit orders allow traders to automate their exits, reducing the need for constant monitoring.
Risk Reminder:
Stop-loss orders help manage losses, but in fast-moving markets, slippage may result in losses that are larger than expected.
What are stop loss orders?
A stop-loss order automatically closes your position if the price hits a predetermined level, helping limit potential losses.
What Are Take-Profit Orders?
Take-profit orders secure profits when the price hits a set target. Setting an appropriate take-profit level can help maximise potential gains without risking too much.
Risk/Reward Ratio and Win Rate
Choosing a suitable risk/reward ratio (such as 1:2 or 1:3) is crucial for long-termtrading. A higher risk/reward ratio, even with a lower win rate, provides greater profitability potential.
Position Sizing
Determining the right position size is essential for managing risk in CFD trading. With leverage, ensure you calculate position size based on the total position controlled, not just the margin.
Managing Volatility
Managing volatility is important when trading CFDs. Use stop losses, set reasonable risk/reward ratios, and keep track of market developments to protect your capital.
Read this article: Learn 10 Risk Management Techniques for Trading so you know how to you them your advantage.
Common Mistakes to Avoid in CFD Trading
New traders often make mistakes due to emotions like greed or fear. Overtrading, poor risk management, and failing to follow a clear strategy can quickly lead to losses.
Tips for Sustainable CFD trading
- Take regular breaks to avoid emotional trading.
- Stay informed and deepen your market knowledge.
- Use a trading journal to track performance and refine your strategy over time.
Ready to Start Trading CFDs?
Explore the markets with a
trusted ASIC-regulated broker
Frequently Asked Questions
-
1
What are the best CFD trading strategies for beginners?
The best strategies for beginners include trend following, breakout trading, and range trading. These strategies help new traders understand market direction and identify key price levels. It’s also important to apply sound risk management techniques and begin with smaller position sizes.
-
2
How do I choose a CFD trading strategy?
Choosing the right CFD strategy depends on your risk tolerance, market conditions, and trading goals. If you're seeking for long-term profit potential, trend following may be suitable. For short-term opportunities, breakout or range trading could be more effective. Start by testing different strategies with a demo account to determine which fits your style.
-
3
How can I manage risk when trading CFDs?
Effective risk management includes using stop-loss and take-profit orders, setting a balanced risk/reward ratio, and managing position sizes. These tools help limit potential losses while locking in profits, especially in volatile markets such as those in Australia.
-
4
Can CFD be profitable?
Yes, CFD trading has the potential to be profitable, but it also carries significant risk. The ability to trade on leverage allows for greater profit potential, but it can also increase losses beyond your initial investment if the market moves against you.
Success in CFD trading depends on your strategy, market knowledge, and effective risk management. Consistent profitability typically comes from sticking to your plan, managing emotions, and using tools like stop-loss orders effectively.
