Big Tech Earnings Spotlight: Microsoft’s Earnings Call, Google’s AI Surge, and Tesla’s Struggles

The latest earnings season has painted a vivid picture of where Big Tech is heading. It is a tale of AI-fueled growth, advertising resilience, and selective stumbles. At the top of the leaderboard, Microsoft (MSFT) and Alphabet (GOOGL) have proven that cloud and AI are no longer just buzzwords; they have evolved into true revenue engines.
In Q3 FY’25 (quarter ended 31 March 2025), MSFT delivered $70.1 billion in revenue (+13% YoY) and EPS of $3.46 (+18% YoY). GOOG crushed Q2’25 expectations with $96.4 billion in revenue (+14%) and EPS of $2.31 (+22%). Microsoft’s Azure jumped 31% YoY while Alphabet’s Google Cloud rose 32%, showing enterprise demand for cloud-enabled solutions remains strong. Microsoft’s Copilot offerings and Alphabet’s AI Overviews are becoming sticky across user ecosystems. Meanwhile, ad revenues delivered double-digit gains, signalling that digital ad demand is robust even in a choppy macro backdrop.
Tesla (TSLA), on the other hand, still seems to be a wildcard, vulnerable to sentiment surrounding Musk’s leadership. The EV giant recently saw a 12% YoY revenue dip, with deliveries and margins under pressure. Yet, some market participants remain optimistic about its AI and robotaxi pivot, despite management warnings of “rough quarters ahead.”
Microsoft Could Benefit From Further AI Demand
Microsoft reports Q4 FY’25 earnings on 30 July 2025. Sustained demand for Azure cloud services and AI-driven products would further boost demand for the stock, driving the technology sector.
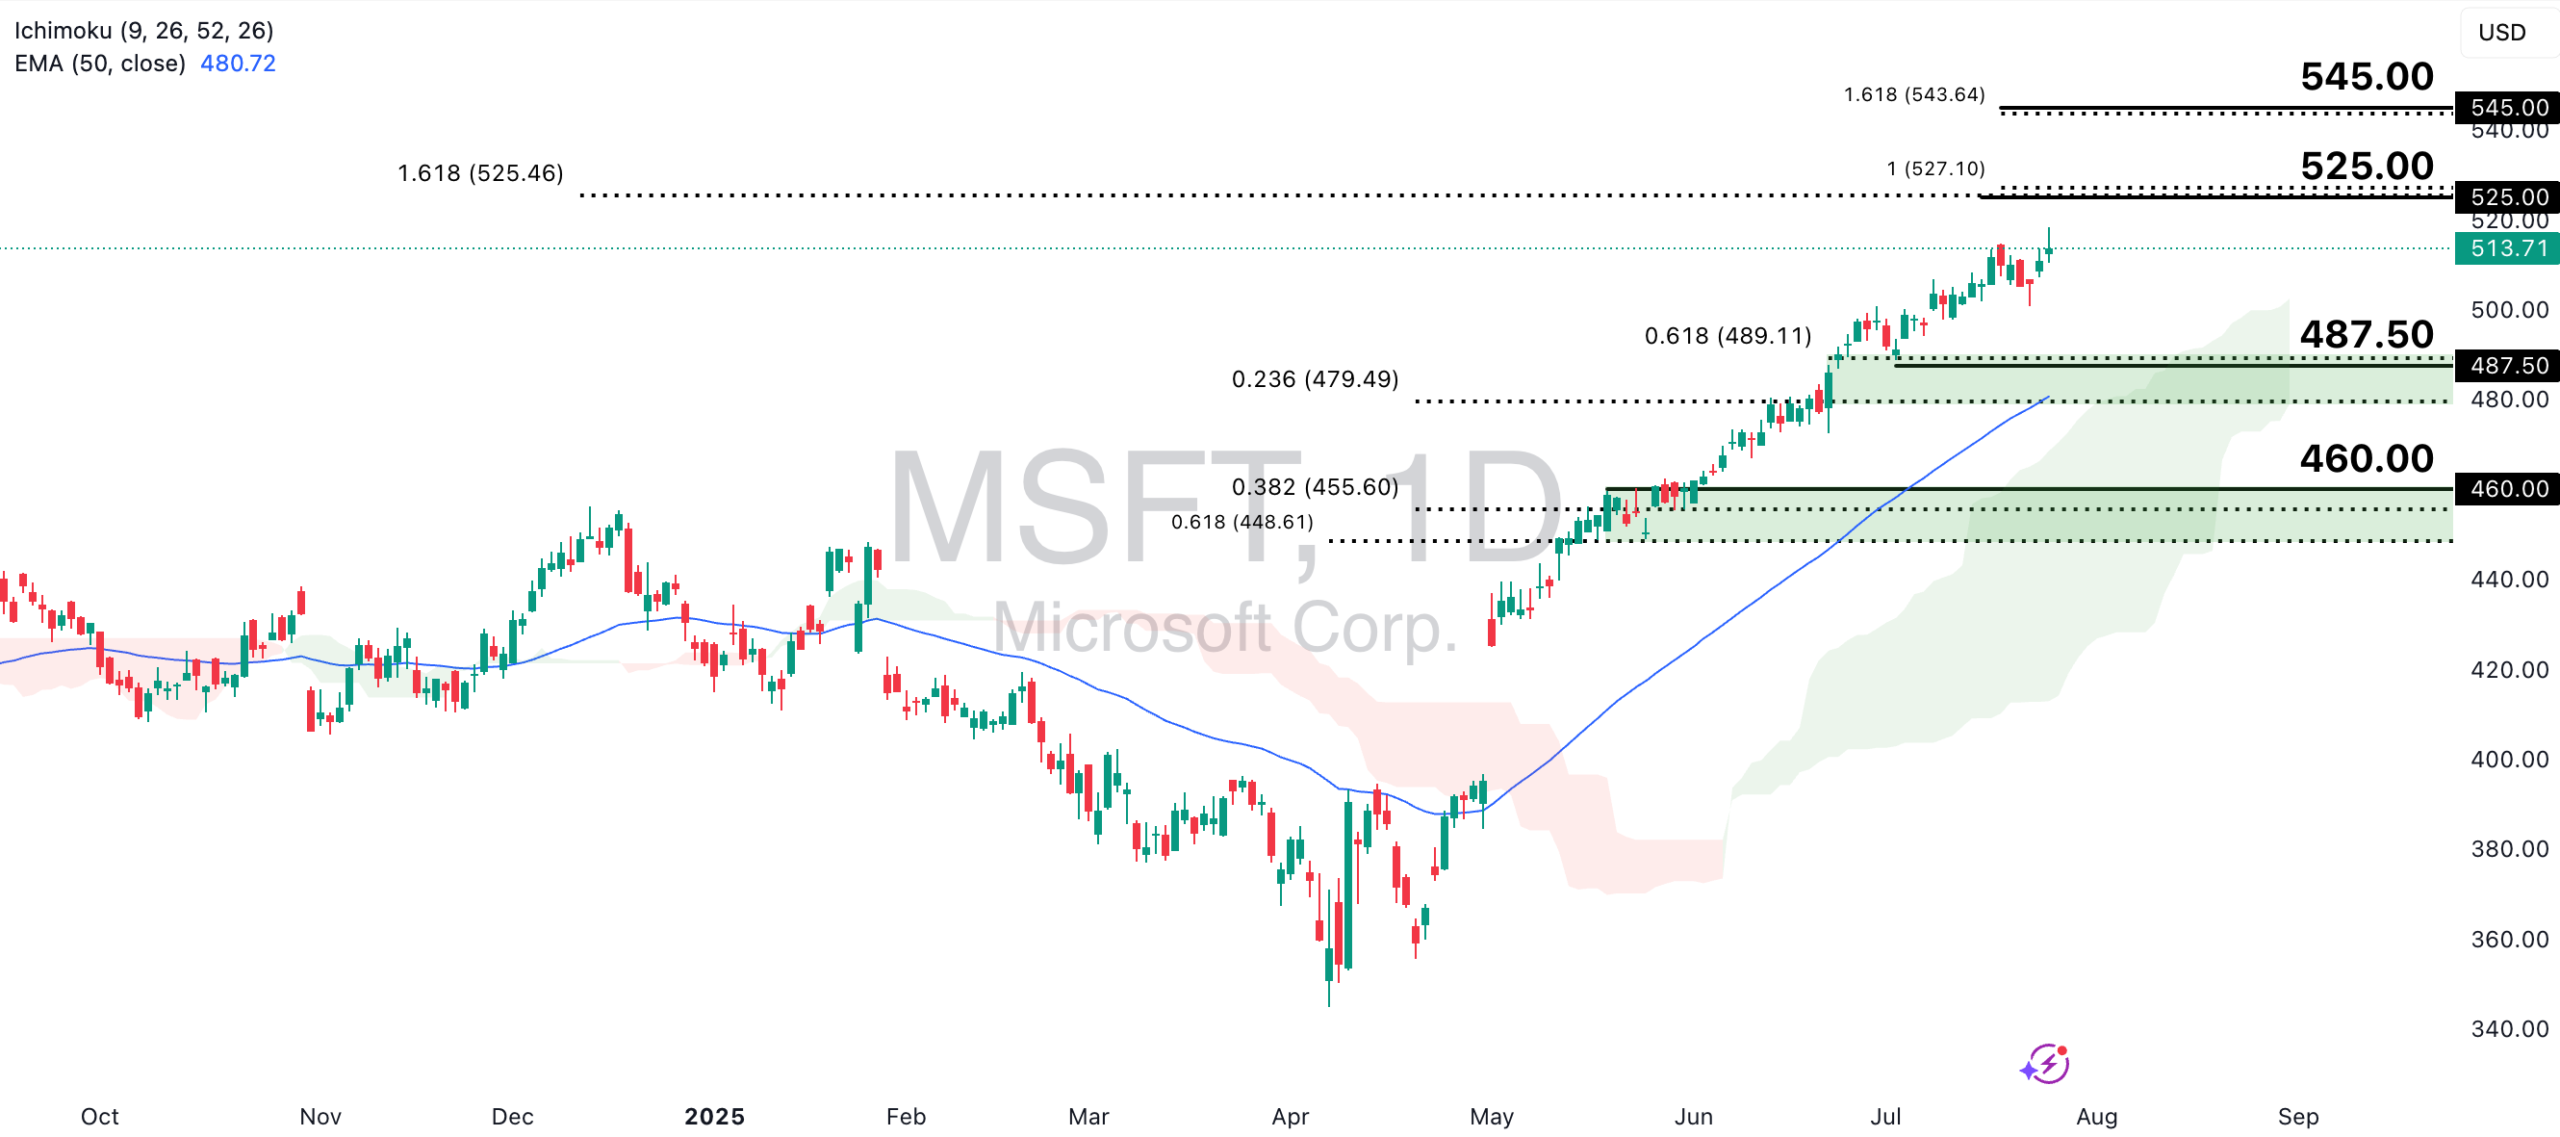
MSFT is seeing strong bullish momentum on the back of strong earnings expectations, with the price holding above both the Ichimoku cloud and 50-EMA. We could see further upside as the price tests the next resistance at the $525 level, in line with an area of Fibonacci confluence, and the subsequent $545 level, in line with the 161.8% Fibonacci Extension level.
However, a pullback in the price could see a retest of the $487.50 support level, in line with the 23.6% and 61.8% Fibonacci Retracement levels. Any further retracements below this level could indicate that the bullish move has run its course and may require a re-evaluation of market sentiment toward the stock.
Google Maintains Bullish Momentum on Earnings Optimism
Google’s stock price turned higher following Q2 2025, as renewed bullish sentiment emerged. Rather than being threatened by the rise of AI, the tech giant has leaned into the trend, embracing AI advancements to strengthen its market position. Looking ahead, keep an eye on further management commentary to better gauge Google’s strategic direction.
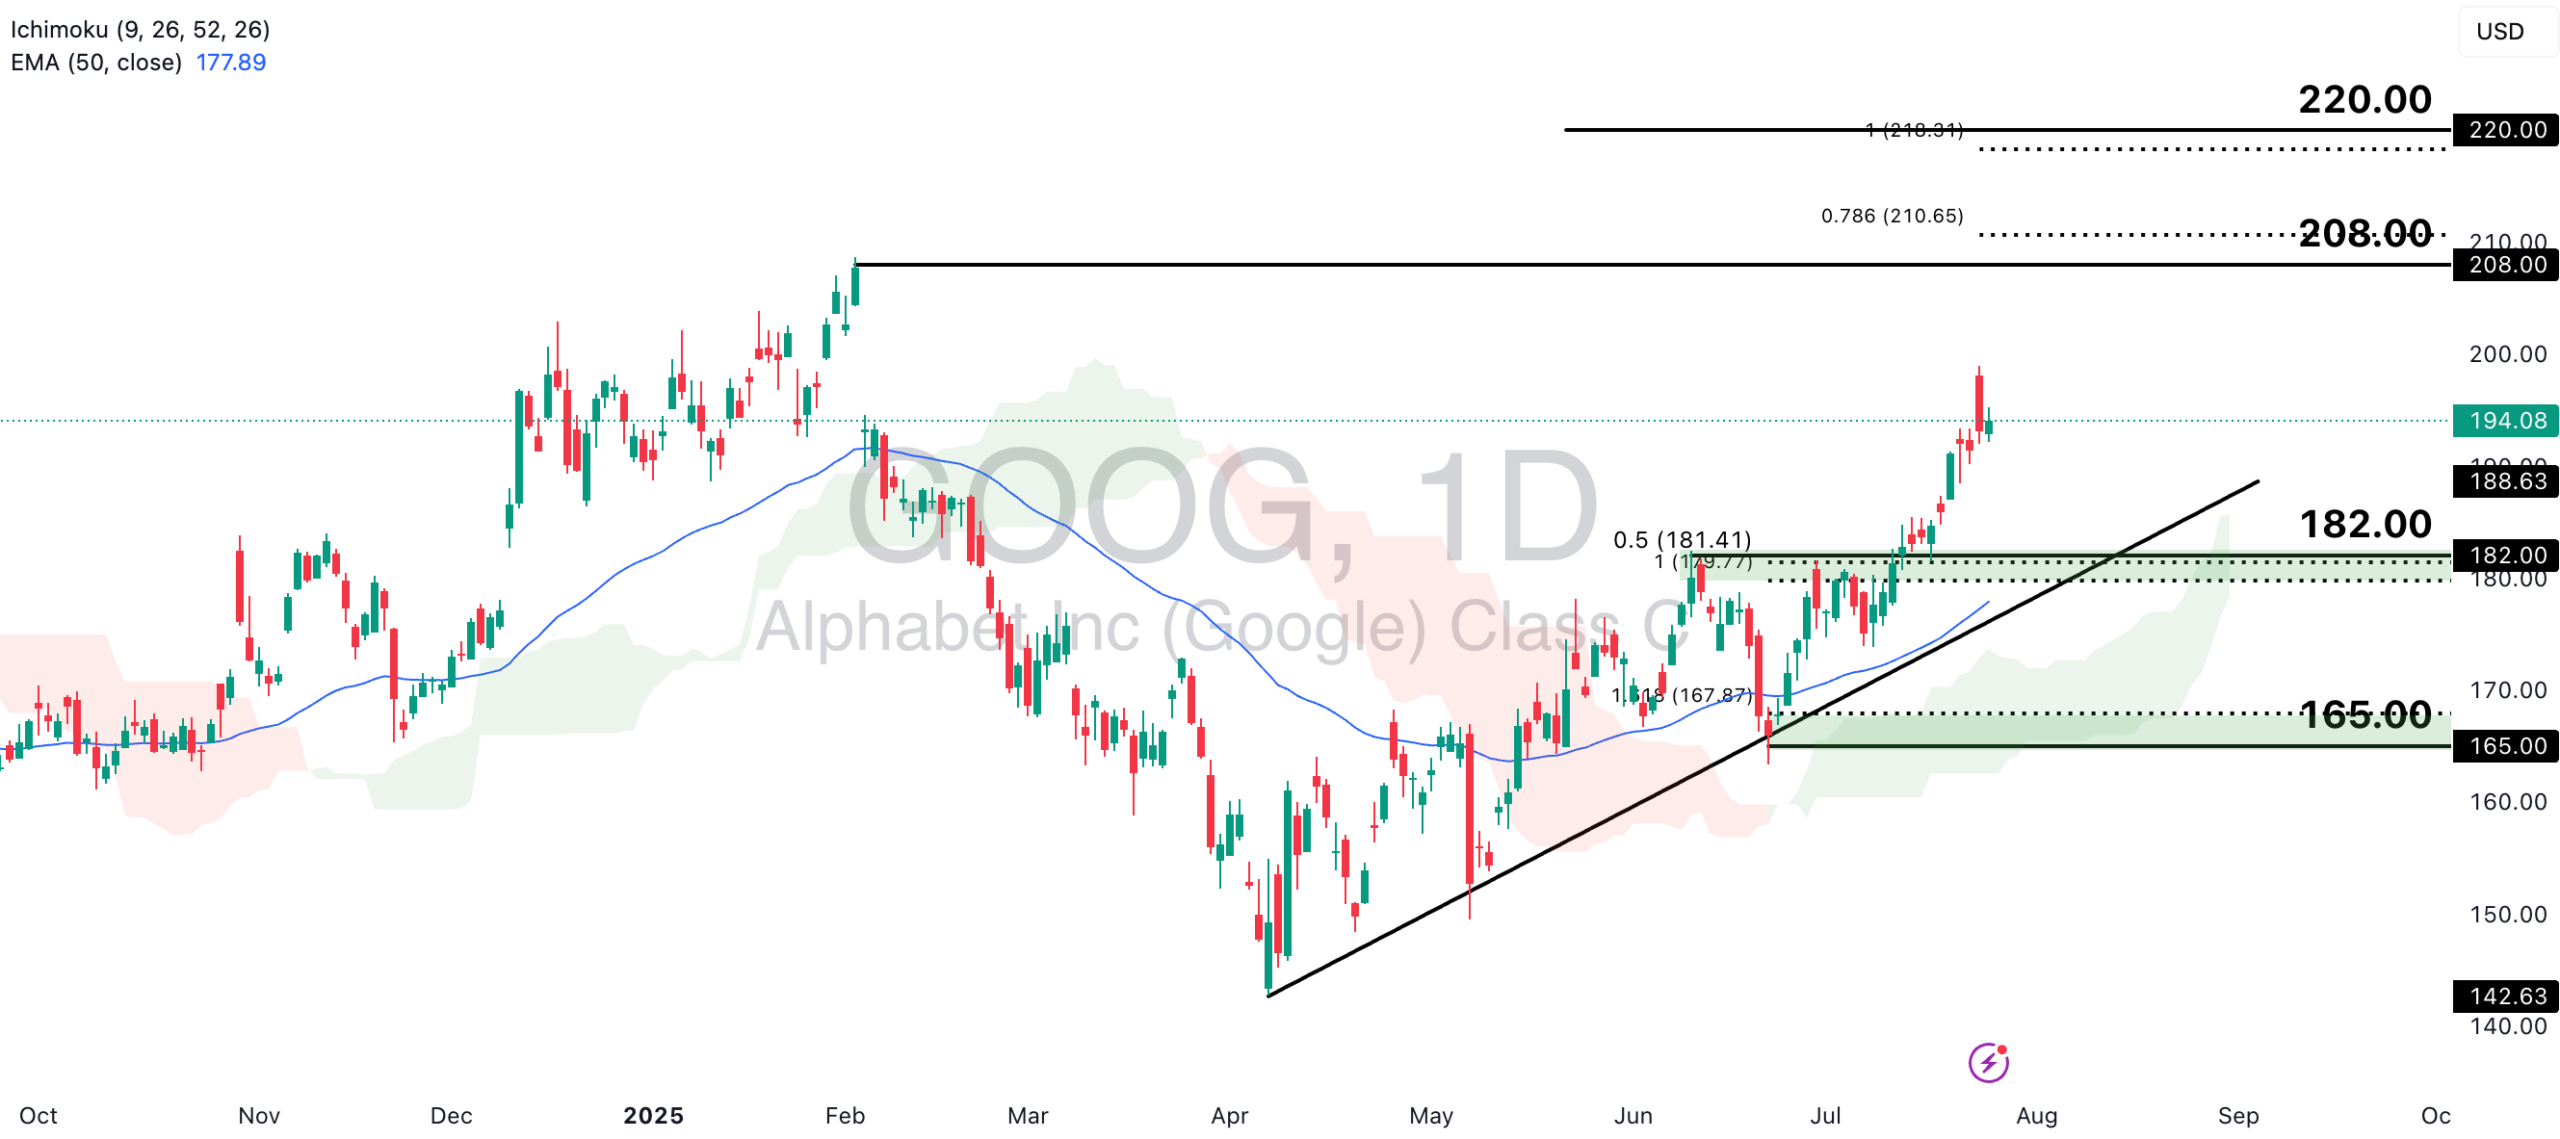
GOOG has seen a recent change in sentiment that pushed the price to the upside. It trades above a series of technical indicators, including the ascending trendline, 50-EMA, and Ichimoku Cloud. A continuation of this bullish move could see the price test the $208 high, in line with the 78.6% Fibonacci Extension level, or even the $220 resistance at the 100% Fibonacci Extension level.
However, a pullback could see the price move closer to the $182 level, a support level in line with the ascending trendline support and an area of Fibonacci confluence. Further retracements could see a retest of the $165 swing low support, indicating that bullish momentum may have faded. If the price reaches this level, it will likely hover below the above-mentioned technical indicators, indicating that a change in sentiment may have occurred.
Tesla Faces Headwinds from Competition and Controversy
Tesla recently secured a major win in its AI ambitions with a $16.5 billion, multiyear agreement with Samsung Electronics to produce its next-generation AI6 chips. The chips will be manufactured at Samsung’s upcoming Texas plant, which aims to power Tesla’s full self-driving and robotaxi technologies. This partnership marks a critical step forward for Tesla’s AI hardware capabilities, central to its long-term growth strategy.
However, despite this technological boost, Tesla’s outlook remains challenged by stiff competition from Chinese EV makers, softer demand, and ongoing concerns around CEO Elon Musk’s political ventures. Market participants will watch closely for updates on Tesla’s robotaxi rollout and management guidance as the company navigates a complex market landscape.
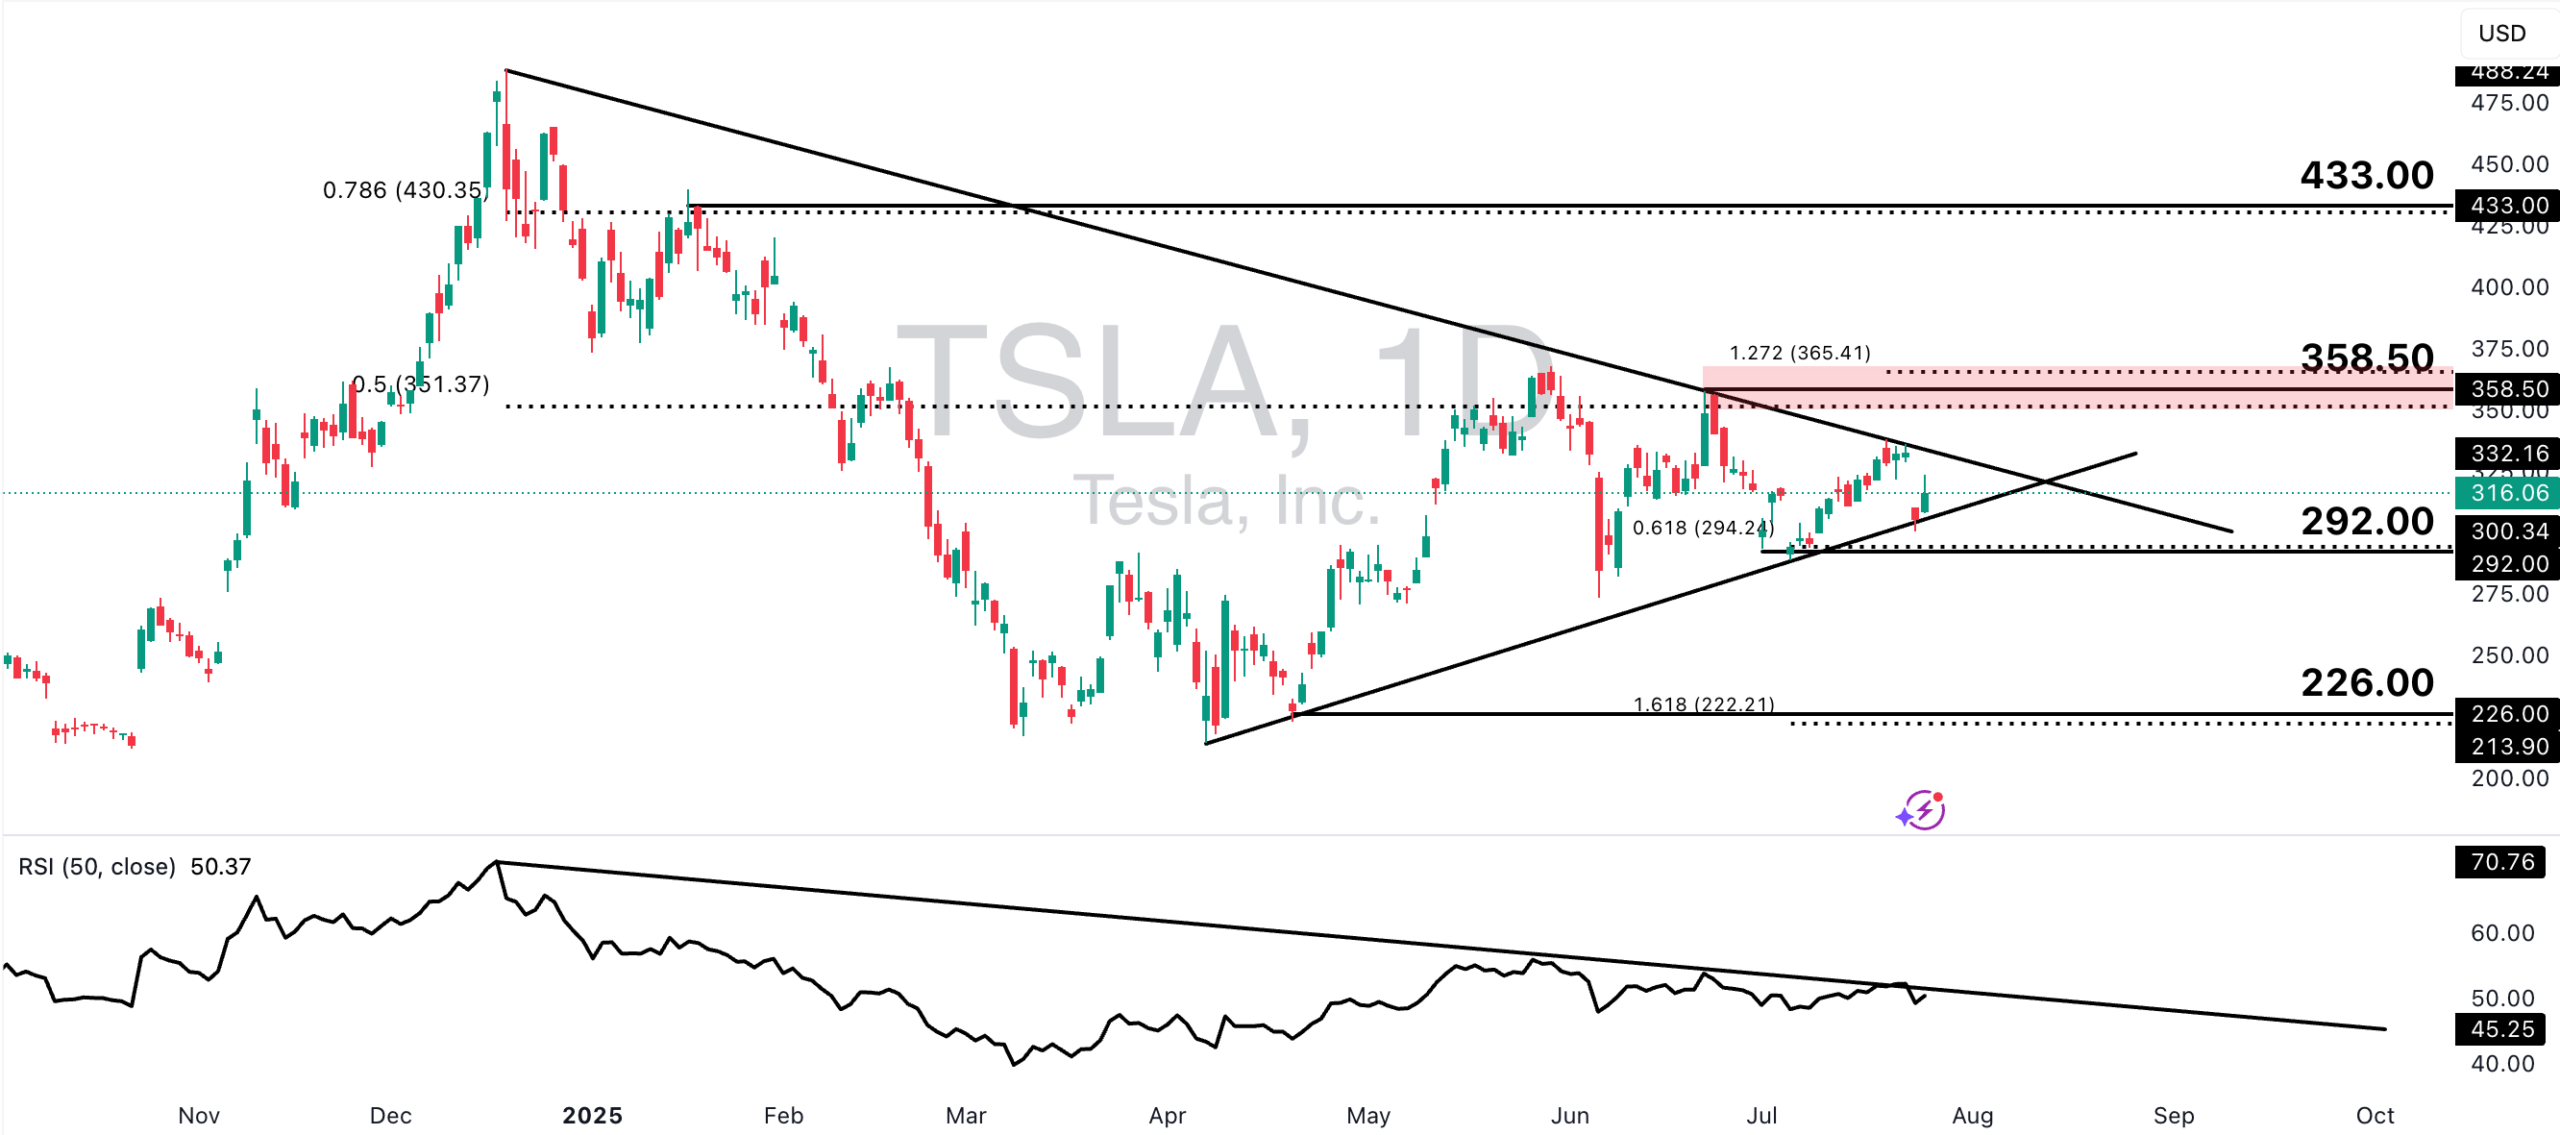
TSLA trades sideways within a symmetrical triangle pattern, bounded by ascending and descending trendlines. While price action remains constrained, the RSI indicator suggests a potential bearish breakout. A decisive move below the $292 support level could open the door for further downside, with the next target near $226, aligning with the 161.8% Fibonacci extension level.
However, if the price were to break towards the upside, we could see a test at the $358.50 resistance, in line with an area of Fibonacci confluence. Further bullish momentum could send the price higher towards the $433 resistance, in line with the 78.6% Fibonacci Retracement level instead.
The technology sector is still in focus, especially given how stretched the U.S. equity market’s valuations are becoming as indices continue pushing to new highs. Keep a close eye out for earnings releases and general economic data releases that could shift sentiment.