Mixed US data sees USD rally extend into Fed meeting

- Dollar gains on more euro weakness over US-EU trade deal
- S&P 500 breaks win streak after no deal yet between US and China
- Treasury yields fall sharply ahead of Q2 US GDP, FOMC meeting
- BoC to sit on its hands, as rate setters await trade news
FX: USD moved further north beyond the 50-day SMA which has acted as resistance to more upside in previous months. Q2 GDP, the FOMC meeting and core PCE inflation data released Thursday could all underpin buying for the greenback. That said, the consensus number for the headline payrolls number is around 100k. Yesterday’s data was mixed as Job Openings fell more than expected in June, accompanied by downticks in the Vacancy and Quits rates. But Consumer Confidence rose more than expected, helped by a decline in pessimism regarding the future. A China trade pause seems inevitable with rolling 90-day deadlines. Whisper it quietly; can we now move on from tariff tensions soon?
EUR fell for a fourth straight day with the high-conviction EUR/USD trade turning after the lop-sided US-EU trade deal. Sentiment has modestly shifted with extended bullish positioning leaving the single currency exposed to adjustment. Technically, prices have broken down through the 50-day SMA at 1.1572 and the neckline of the double top reversal pattern which has developed since late June. If this break is sustained, the measured move would see prices closer to 1.14.
GBP outperformed its peers apart from the yen. UK PM Starmer’s cordial relationship with President Trump is notable compared to other so-called allies. Cable still looks bearish having lost a support zone below 1.34. EUR/GBP has plunged after printing a high at 0.8752, last seen in November 2023. Long positioning may have turned, tied up with the crowded long EUR/USD trade.
JPY printed a doji denoting a pause in price action after three strong days of buying. That actually meant the yen outperformed as the US 10-year Treasury yield fell below both the 50-day and 200-day SMAs. Eyes are on the BoJ meeting on Thursday, with an expected more hawkish bias coming into play.
AUD fell again as traders eyed important inflation data. CAD weakened for a fourth straight day as the major made five-week highs. The BoC meeting will see policymakers sit on their hands and watch data.
US stocks: The S&P 500 printed down 0.3% at 6,371. That ended a six-day win streak. The Nasdaq settled lower, by 0.21% at 23,308. The Dow Jones finished down at 44,633, losing 0.46%. Industrials were the main laggard hit by Boeing (-4.3%) and UPS (-10.6%) post-results. The latter didn’t provide revenue or operating profit guidance amid the current macro uncertainty. Real Estate, Utilities, and Energy were the main gainers. The latter was buoyed by gains in excess of 3%, as Brent crossed above its 200-day SMA at $70.89. Crude was helped by Trump reiterating his deadline to Russia and a warning to China not to purchase Russian oil. Meta and Microsoft kick off the next Mag 7 earnings after the US closing bell. Capex on AI infrastructure could be key for both stocks. There will be questions over Reality Labs for META and if MSFT has allocated too much to scaling capacity.
Asian stocks: Futures are mixed. APAC equities were mostly mixed as well as traders digested the trade news and latest deals. The ASX200 saw weakness in financials and telecoms. The Nikkei 225 turned lower for a third day printing above 42,000 late last week. There was much speculation about PM Ishiba’s impending (or not) departure. The Shanghai Comp and Hang Seng moved lower as markets awaited news from the US-China trade talks in Sweden.
Gold turned the selling tide even as the dollar surged higher. Prices in bullion have dipped below the 50-day SMA at $3,335, which has capped the downside through this year, but printed an inside day. The long-term upward trendline from the December lows has also been broken.
Day Ahead – Australia CPI, US GDP, BoC and FOMC Meetings
A jam-packed day kicks off with Australian Q2 inflation data that will likely influence market pricing for another possible rate cut at the next RBA meeting in mid-August. Key will be the core inflation measures – trimmed and weighed mean – which have remained in the bank’s 2-3% target range for the prior two quarters. The former is forecast to print at 0.7% q/q with the annual metric around 2.7%, down from the prior 2.9%. Money markets have priced in an 80%+ chance of a 25bps RBA rate cut next month.
The BoC will leave rates unchanged at 2.75% amid trade uncertainty and unexpectedly positive data. Surveys are improving, the jobless rate fell below 7% and CPI m/m printed at 0.1%. That all gives rate setters time to stay in neutral and assess the trade outlook. However, there is a risk that officials could turn mildly dovish, which could help USD/CAD further cement the building of a base.
The Fed is expected to keep rates unchanged at 4.25-4.5%. A cautious, data dependent stance is still expected, with officials currently comfortable with the underlying resilience of the economy. That is likely to be seen in the latest Q2 GDP figures which will likely show growth of 2.5%+. Concerns about rising inflationary pressures from tariffs have yet to show up meaningfully in the data, but the next few months are predicted to get a bump. Any labour market weakness could put policymakers in a trickier position as they will have to find a balance between rising inflation and potential rising unemployment – the two sides of their dual mandate.
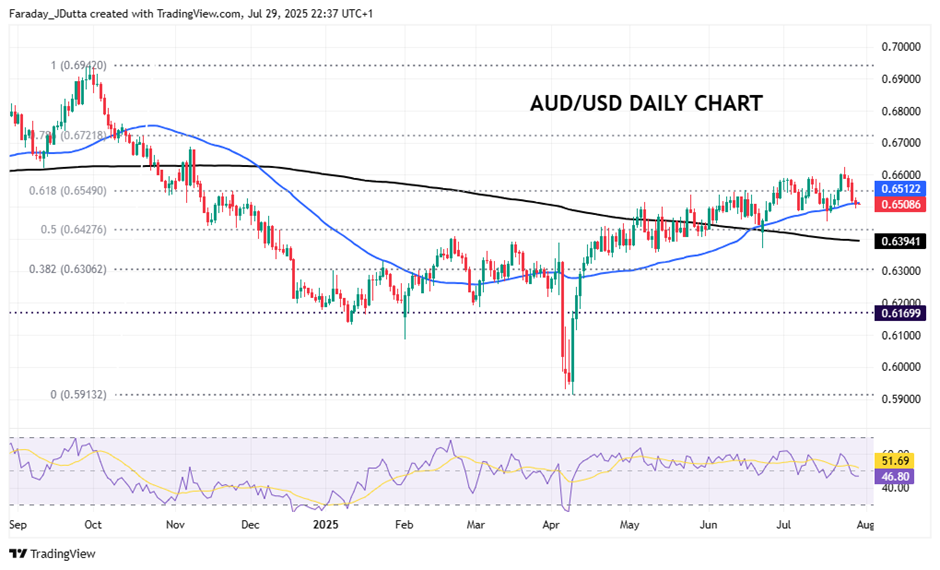
Chart of the Day – AUD/USD finds support again at 50-day SMA
The aussie has fared relatively well versus the dollar this month, with only the CAD faring better, albeit both are in the red. Better global growth prospects from the trade deals announced has helped commodity dollar currencies. But technically, once again, the major failed around 0.66 with the spike high at 0.6625 presaging four straight days of selling. A major Fib retracement level (61.8%) of the October 2024 to April 2025 low sits at 0.6549 with the 50-day SMA at 0.6512. Below here is the midpoint of the move at 0.6427 with the 200-day SMA below at 0.6394.