SPX, NAS100, DJ30: Rally at Risk as Headwinds Build

U.S. equities are treading water as traders weigh softening inflation trends against a cautious Federal Reserve. Markets still expect around two rate cuts before 2025 ends, but there is growing chatter that the Fed may already be behind the curve, especially as other major central banks start cutting interest rates.
However, the escalating conflict in the Middle East, now exacerbated by direct U.S. involvement, is raising the stakes. Although the VIX, a volatility measure of U.S. markets, remains markedly low, fear is simmering beneath the surface. Traders are closely monitoring crude oil prices and developments in the region, particularly around the Strait of Hormuz, where a shutdown could rattle global energy flows. U.S. President Donald Trump’s announcement of a “complete and total” ceasefire between Israel and Iran offered a brief moment of relief. However, with details unclear and tensions high, markets remain cautious about whether the truce will hold.
Despite the noise, price action across major indices remains technically bullish. Traders seem to be brushing off Trump’s tariff threats as temporary. Nevertheless, the impacts of tariffs are still feeding into the broader economy, and any indication of a resurgence in inflation or an economic slowdown could rapidly derail the bullish momentum and trigger a sharp reversal across risk assets.
NAS100 Testing Near Previous Highs
The NASDAQ 100 (NAS100) has outperformed, supported by tech earnings strength and AI-driven momentum. However, breadth has been thinning, and elevated valuations face renewed scrutiny. As prices reach previous highs, it will be important to watch whether the fervor can be sustained in the tech sector.
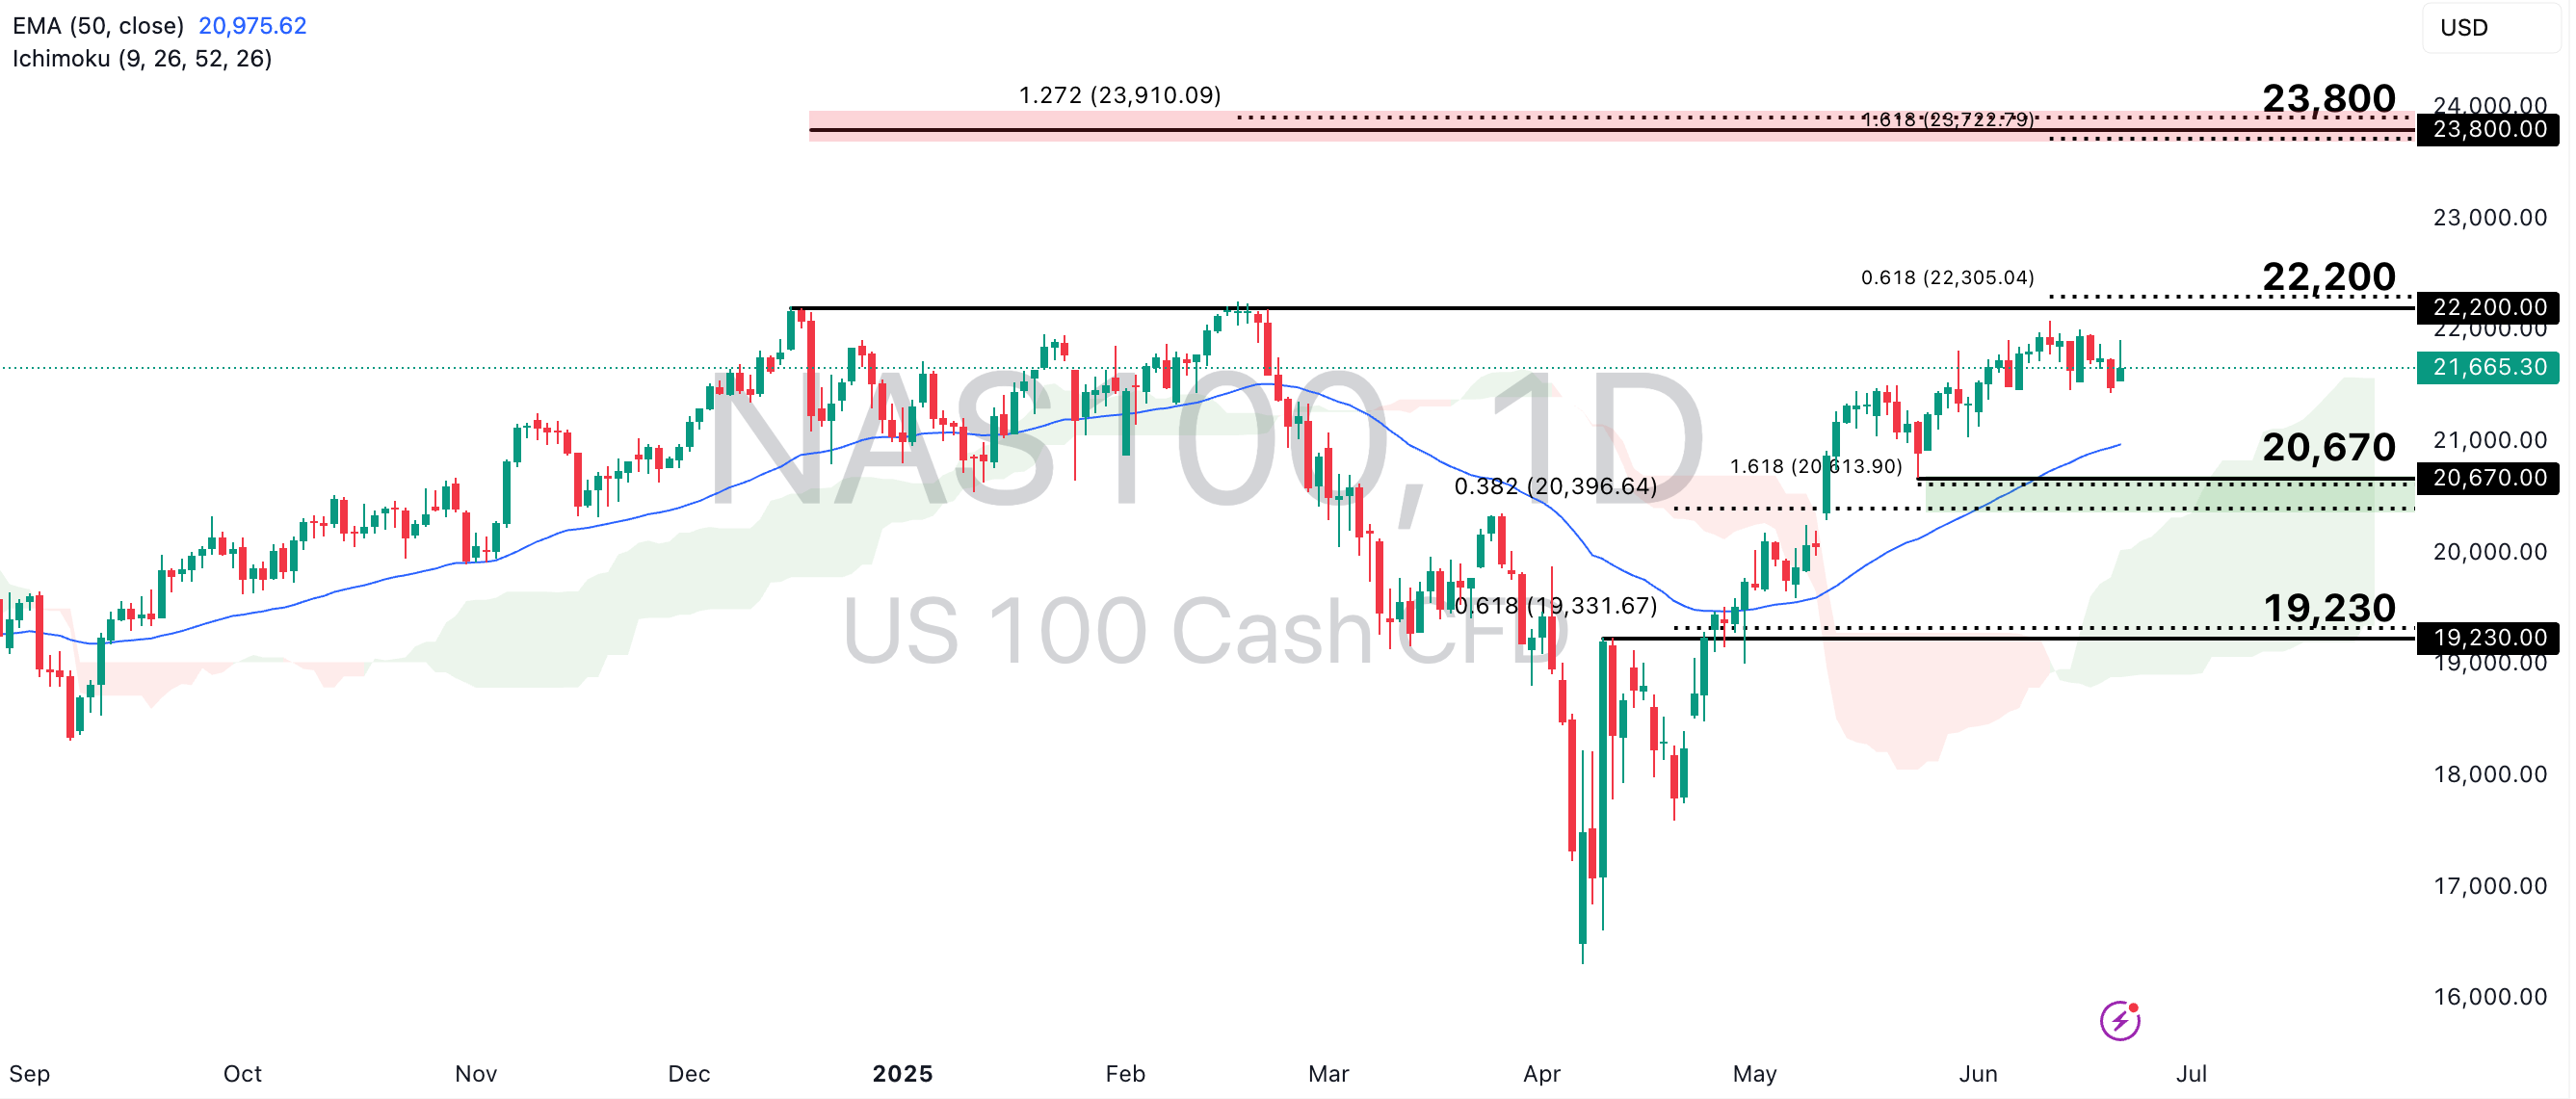
NAS100 is hovering near highs at the 22,200-point resistance, in line with the 61.8% Fibonacci Extension level. The price remains above the Ichimoku cloud and 50-EMA, indicating continued bullish momentum. A clear break-and-close above the 22,200 level would likely see the price reach new highs at the 23,800-point resistance, which aligns with a Fibonacci confluence zone.
However, a retracement could see the price pull back towards the 20,670-point support zone, which aligns with the 38.2% Fibonacci Retracement, 161.8% Fibonacci Extension levels, and the 50-EMA.
DJ30 Trading Sideways After Bullish Breakout
The Dow Jones Industrial Average (DJ30) has lagged slightly and traded sideways after a bullish breakout last month, reflecting cyclicals’ sensitivity to macro uncertainty, trade tensions, and yield curve dynamics. Broader strength in U.S. equities across sectors is needed to sustain bullish momentum in the DJ30 going forward.
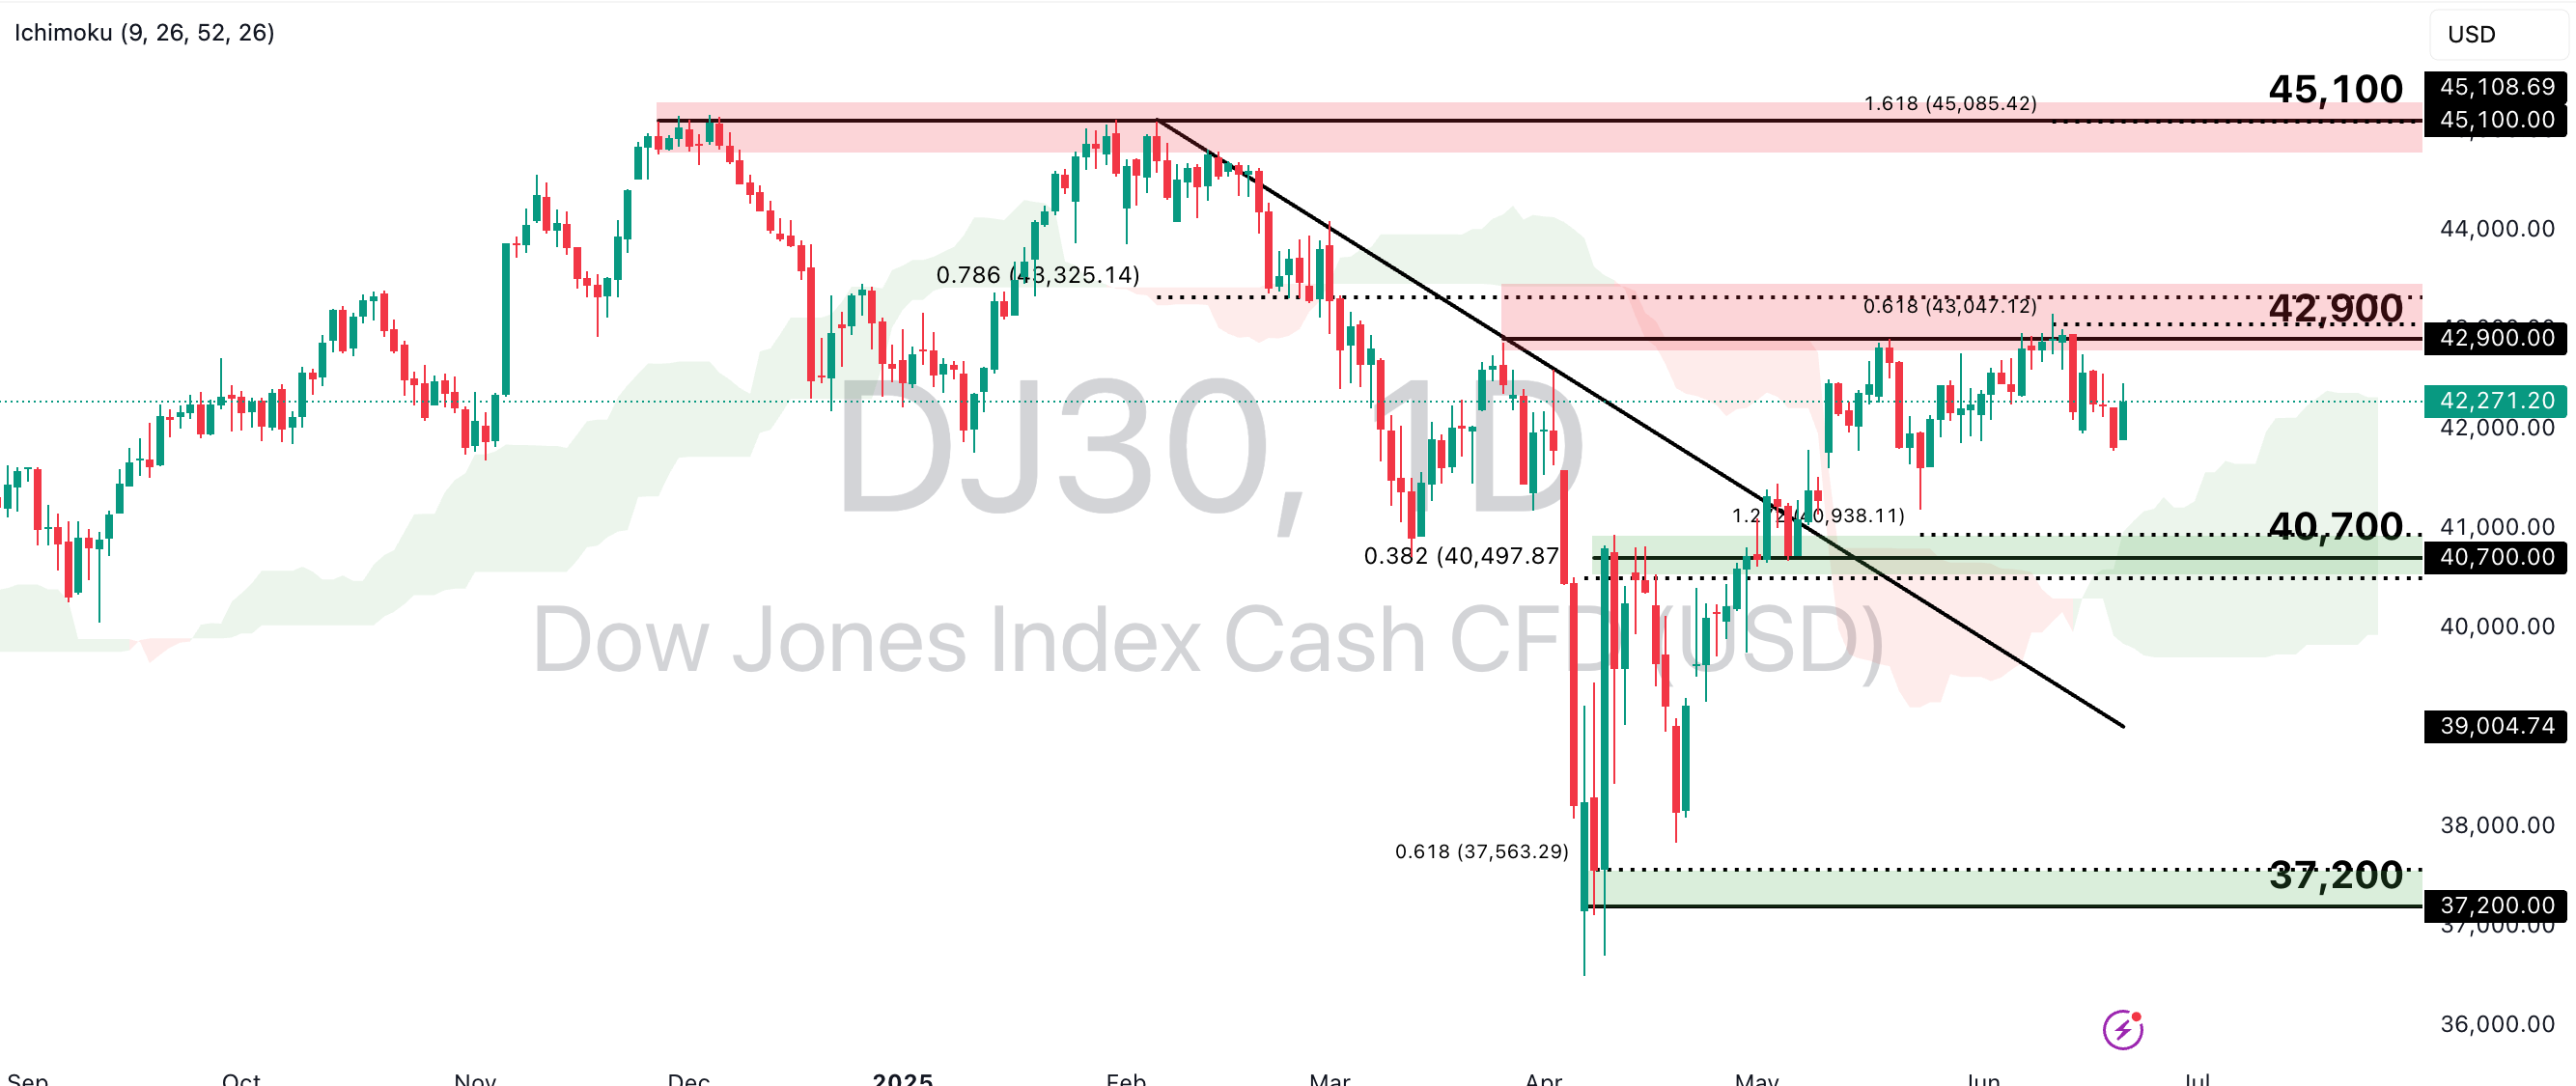
DJ30 is still in a bullish technical setup, as it holds above the Ichimoku cloud after a bullish breakout in May. A minor retracement could see the price approach the 40,700-point support zone, in line with the 38.2% Fibonacci Retracement and 127.2% Fibonacci Extension levels. A bounce at that level could see a continuation of the bullish momentum, where the price could approach previous highs again at the 42,900-point and 45,100-point swing high resistance levels.
However, a deeper retracement and break below the 40,700-point support could prompt a decline toward the 37,200-point support zone, which aligns with the 61.8% Fibonacci Extension level, where bullish momentum should be re-evaluated.
SP500 Seeing Pullbacks Amidst Bullish Momentum
The S&P 500 (SP500) is hovering around the 6,000 level, showing resilience but clear fatigue. Recent Fed commentary has reinforced a “higher-for-longer” stance, causing equities to stall near resistance zones. However, further soft prints in inflation numbers could further push the index higher as the likelihood of rate cuts from the Fed increases.
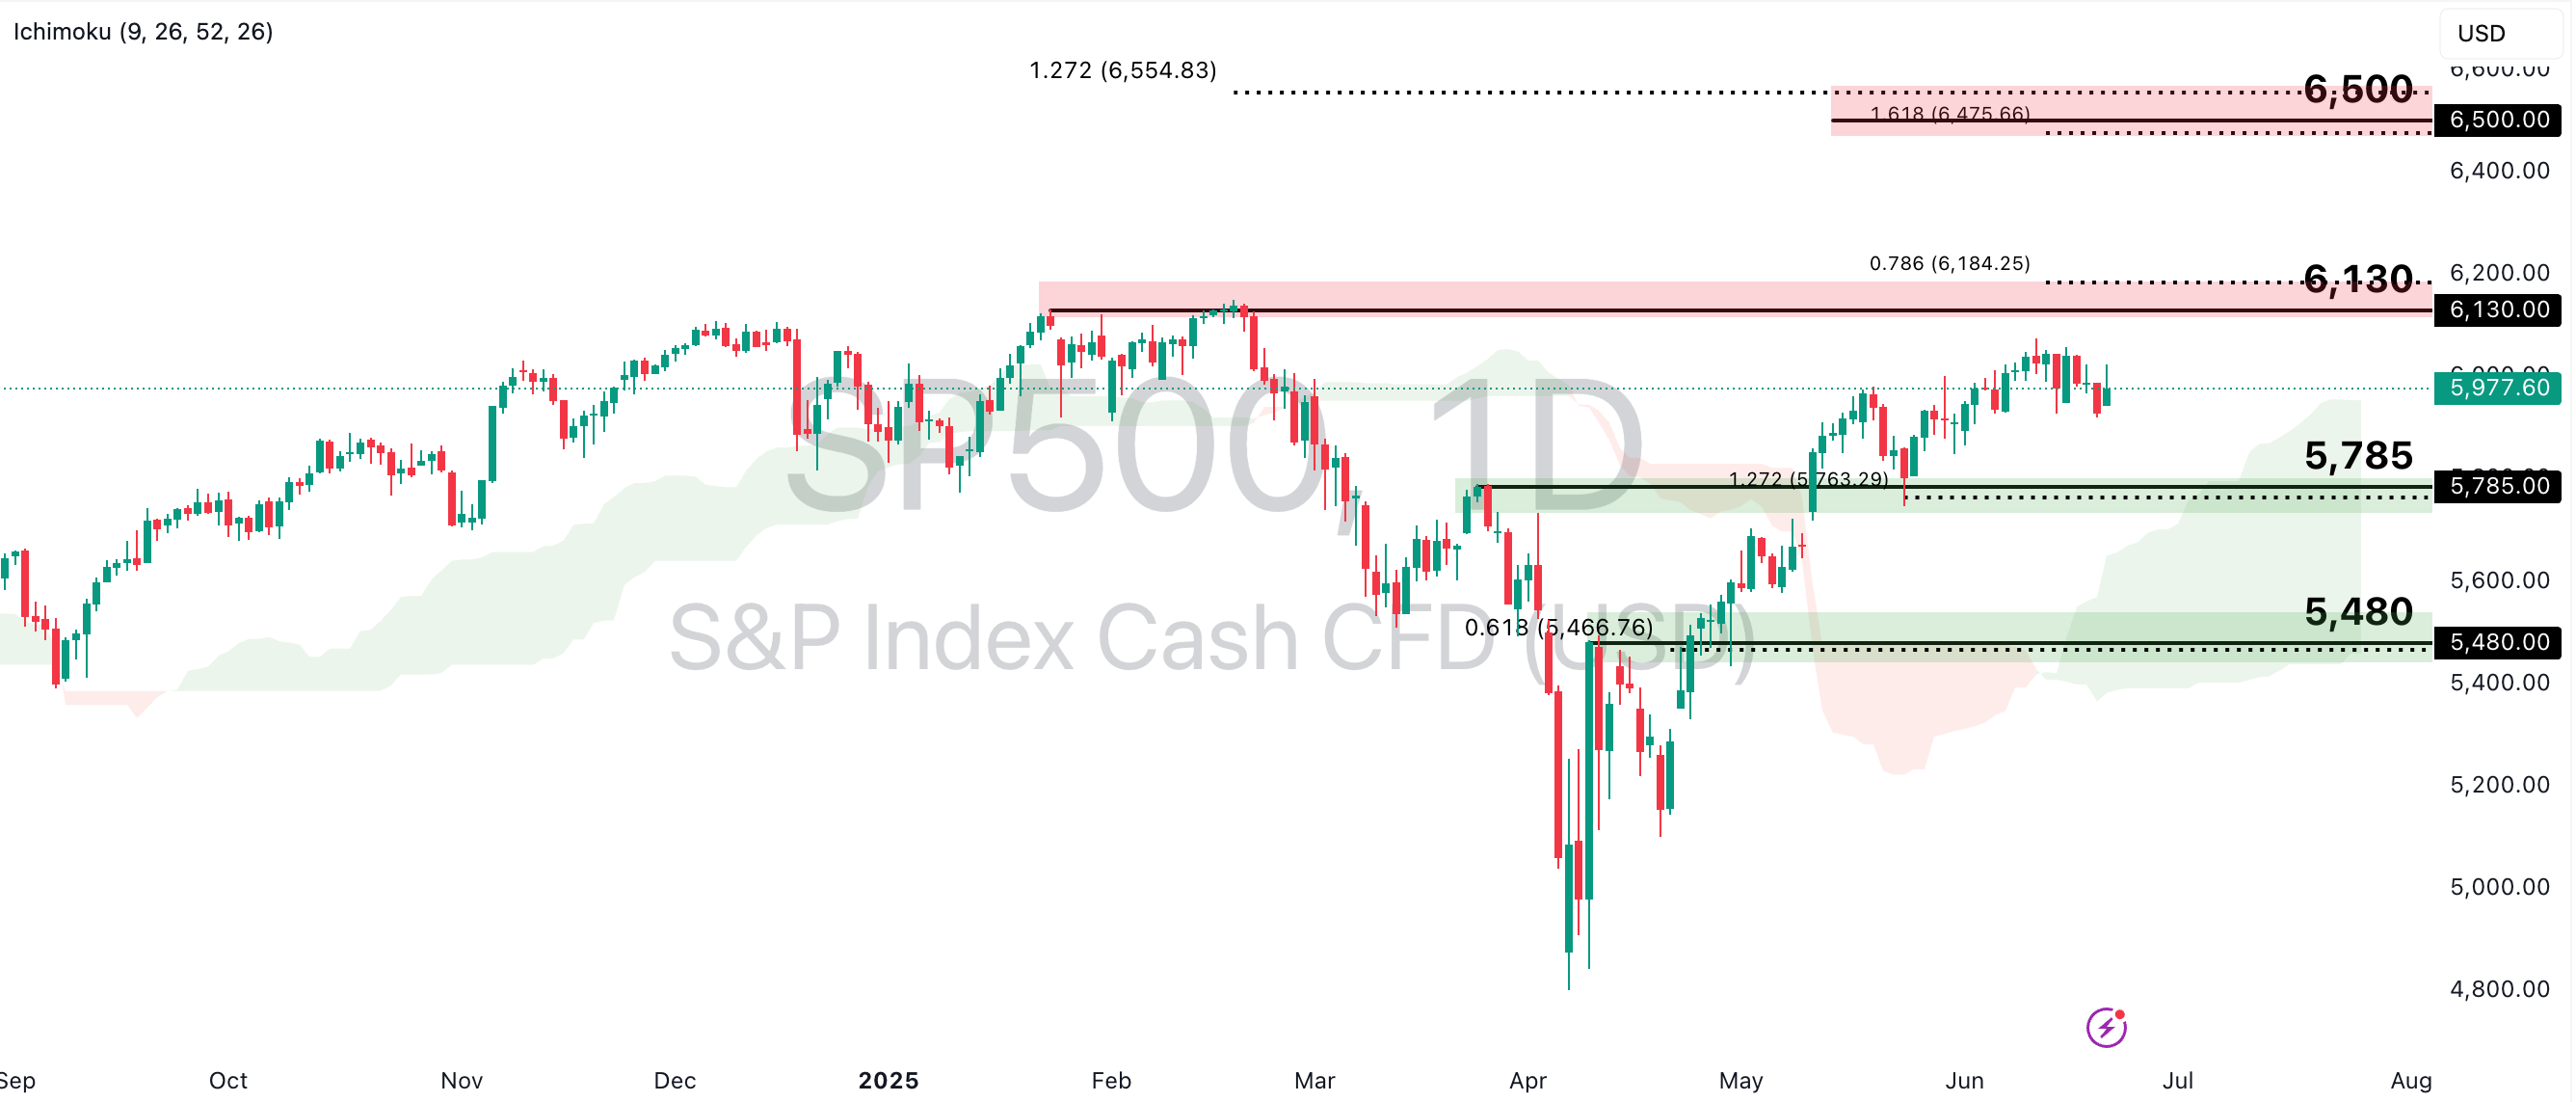
SP500 is pulling back from highs as the price now approaches the 5,785-point support, in line with the 127.2% Fibonacci Extension level. A continuation of bullish momentum should see a bounce from this point and a further push higher towards the 6,130-point swing high resistance, in line with the 78.6% Fibonacci Extension level.
However, further market uncertainty could cause the price to continue trading sideways between these two levels. A significant shift in risk sentiment could cause the price to dip, with a break below the 5,785-point support prompting a further slide toward the 5,480-point support zone, which aligns with the 61.8% Fibonacci Retracement level.
Equity markets are holding up, but just barely. Beneath the surface of technical strength lies a complex mix of risks, from geopolitical tensions to persistent inflation and renewed trade uncertainty. Keep an eye out for any developments in geopolitical events that could drastically shift risk sentiment, as well as economic releases on key indicators, for more insights into the underlying health of the economy and potential policy responses.