Triple Threat or Triple Treat? A Closer Look at NAS100, DJ30, and S&P 500

As we move ahead from mid-2025, the U.S. equity markets remain at a pivotal crossroads. Although headlines are dominated by sticky inflation, uncertainty around the Fed’s rate path, and volatile trade policy, U.S. stock indices have shown encouraging signs of recovery since the start of the year.
So, what is driving the optimism, and what risks remain?
The latest rally was supported by a U.S. trade court decision to block President Trump’s proposed “Liberation Day” tariffs, which aimed to impose broad duties on countries with trade surpluses against the U.S. This ruling has tempered fears of an escalating trade war and suggests that, for now, tariff tensions may be easing. The market interpreted the decision as a sign that legal and institutional checks remain intact, offering a degree of policy predictability that had been in doubt.
With trade risk temporarily dialled back, traders are shifting focus to the potential for the Trump administration to pursue more corporate-friendly policies, such as tax cuts and deregulation, which could bolster earnings and market sentiment.
Adding fuel to this momentum is seasonal demand, as the S&P 500 typically sees one of its strongest periods mid-year, particularly after Memorial Day. Together, these factors have helped lift sentiment across U.S. indices.
NAS100 – Tech’s Relentless Charge, But Earnings Will Be Key
The NAS100 continues to ride the tailwind of the AI revolution, with Nvidia, Microsoft, and Alphabet leading the charge. As of May 2025, the forward P/E is estimated at roughly 28x, a premium to historical averages, underscoring ongoing enthusiasm in the tech sector.
However, this also presents valuation risks, especially for AI-related companies that have been riding the hype for the past few months. Traders would do well to watch for key earnings from the largest constituents of the index, along with inflation indicators for insights into the Fed’s rate path.
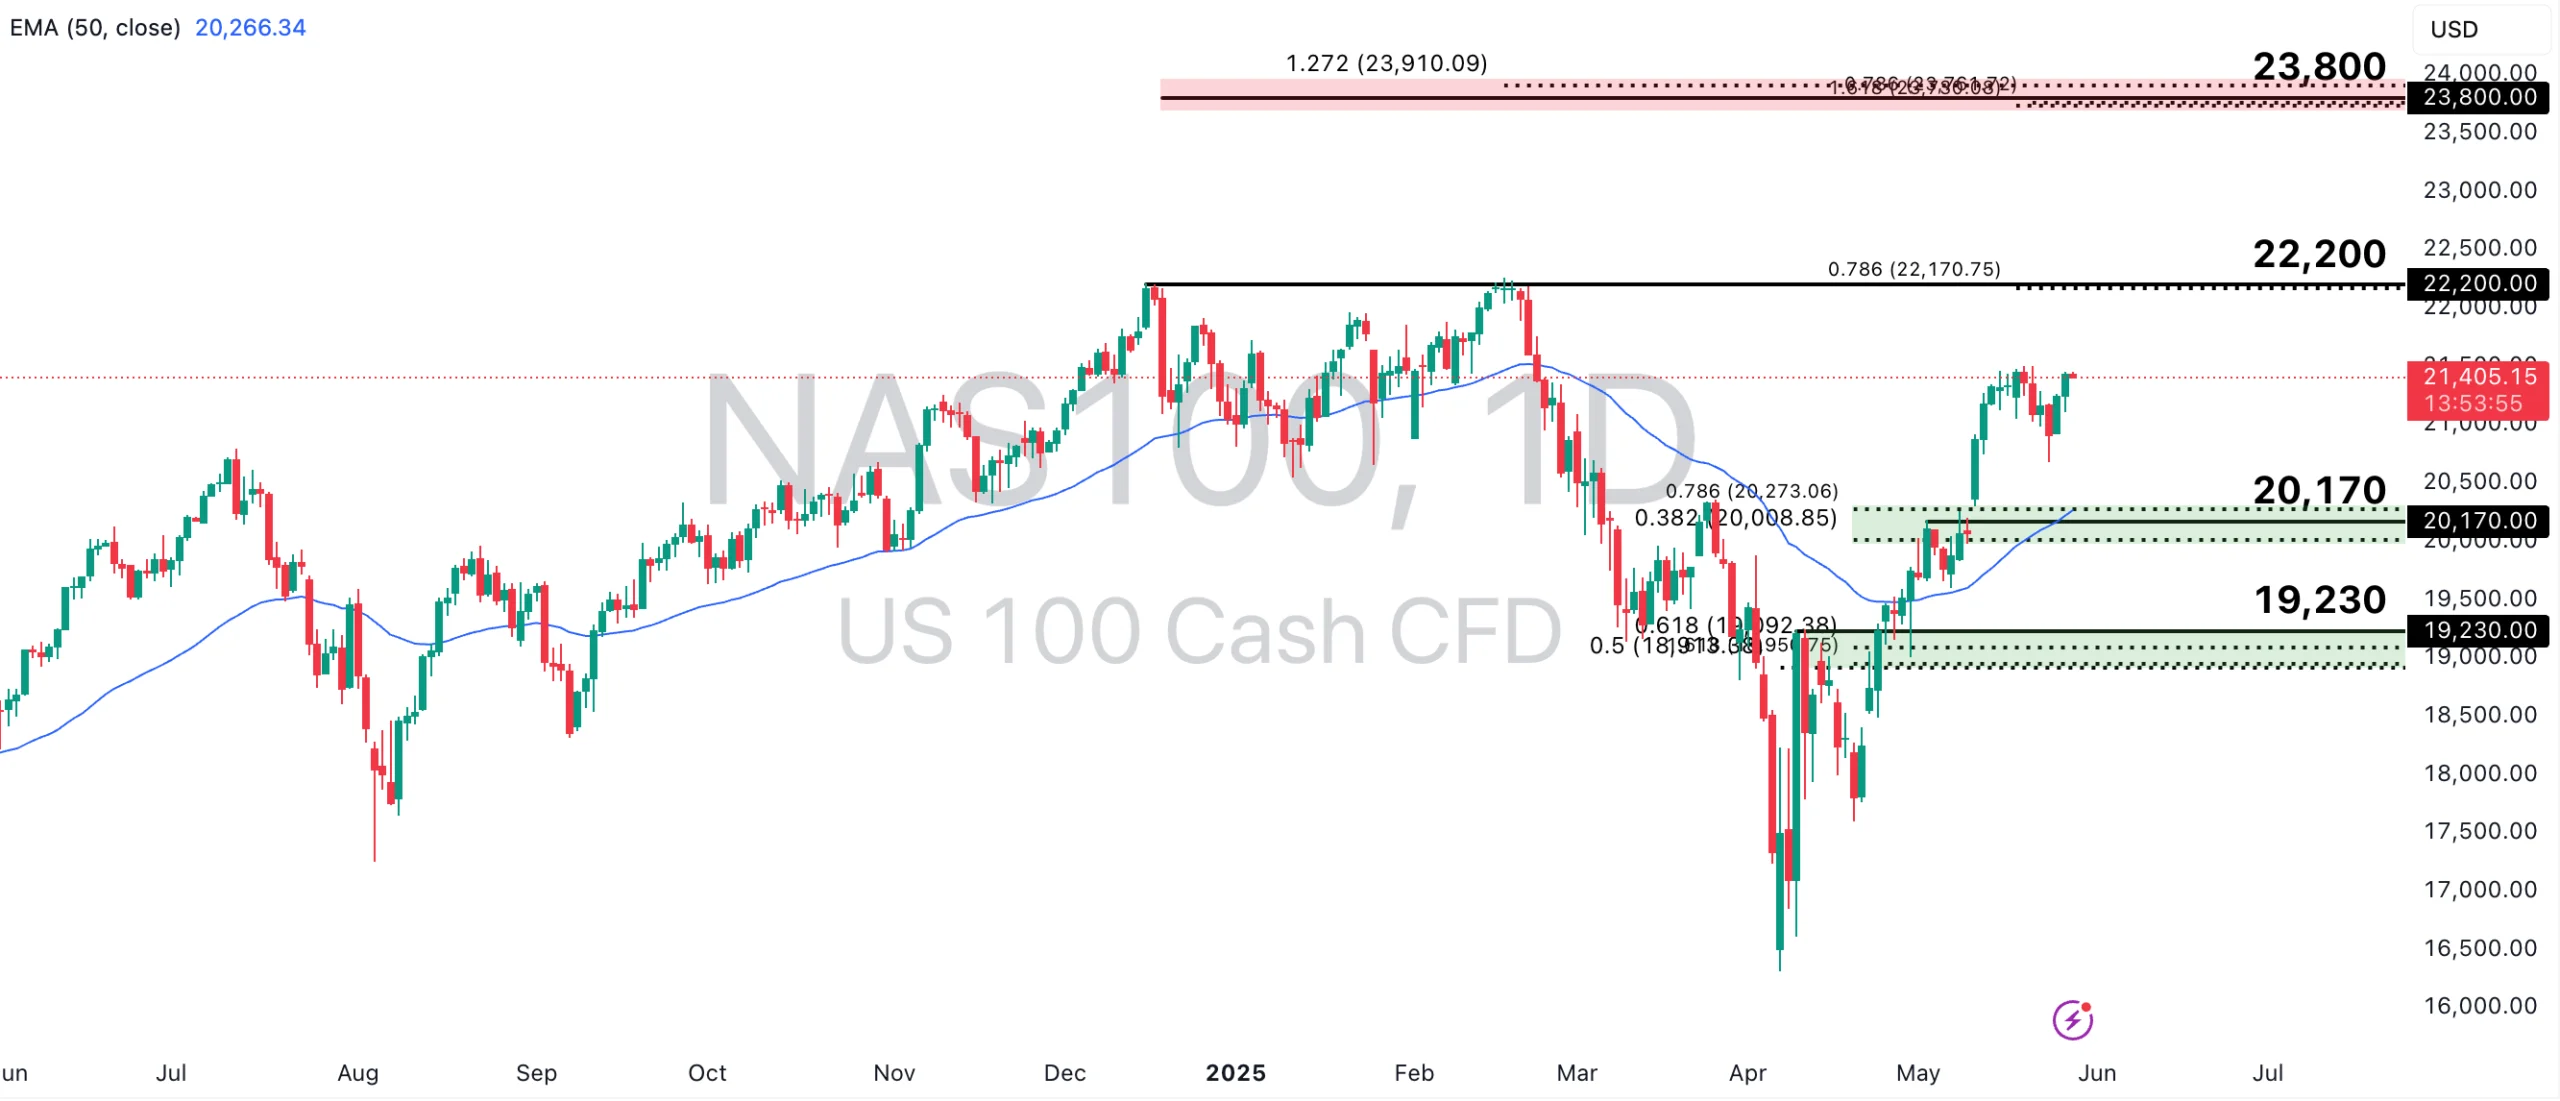
NAS100 has seen a bullish reversal since April 2025 and now holds above the 50-EMA. A continuation of this bullish momentum would see the price approach the 22,200-point swing high resistance, in line with the 78.6% Fibonacci Extension level, or even towards the 23,800-point resistance level, in line with the key zone of Fibonacci confluence.
However, a throwback could see the price retest the 20,170-point support zone, in line with the 50-EMA, 38.2% Fibonacci Retracement, and 78.6% Fibonacci Extension levels. A deeper retracement could prompt a retest of the 19,230-point support zone, also in line with a key Fibonacci confluence zone.
DJ30 – Is the Defensive Rotation Short-Lived?
The DJ30 has experienced a slower climb, but the index is gaining from a defensive rotation. With a shift to cyclicals earlier this year when uncertainty was elevated, stocks like Caterpillar and JPMorgan have shown renewed strength. Looking ahead, the DJ30 could continue performing if broad market optimism holds.
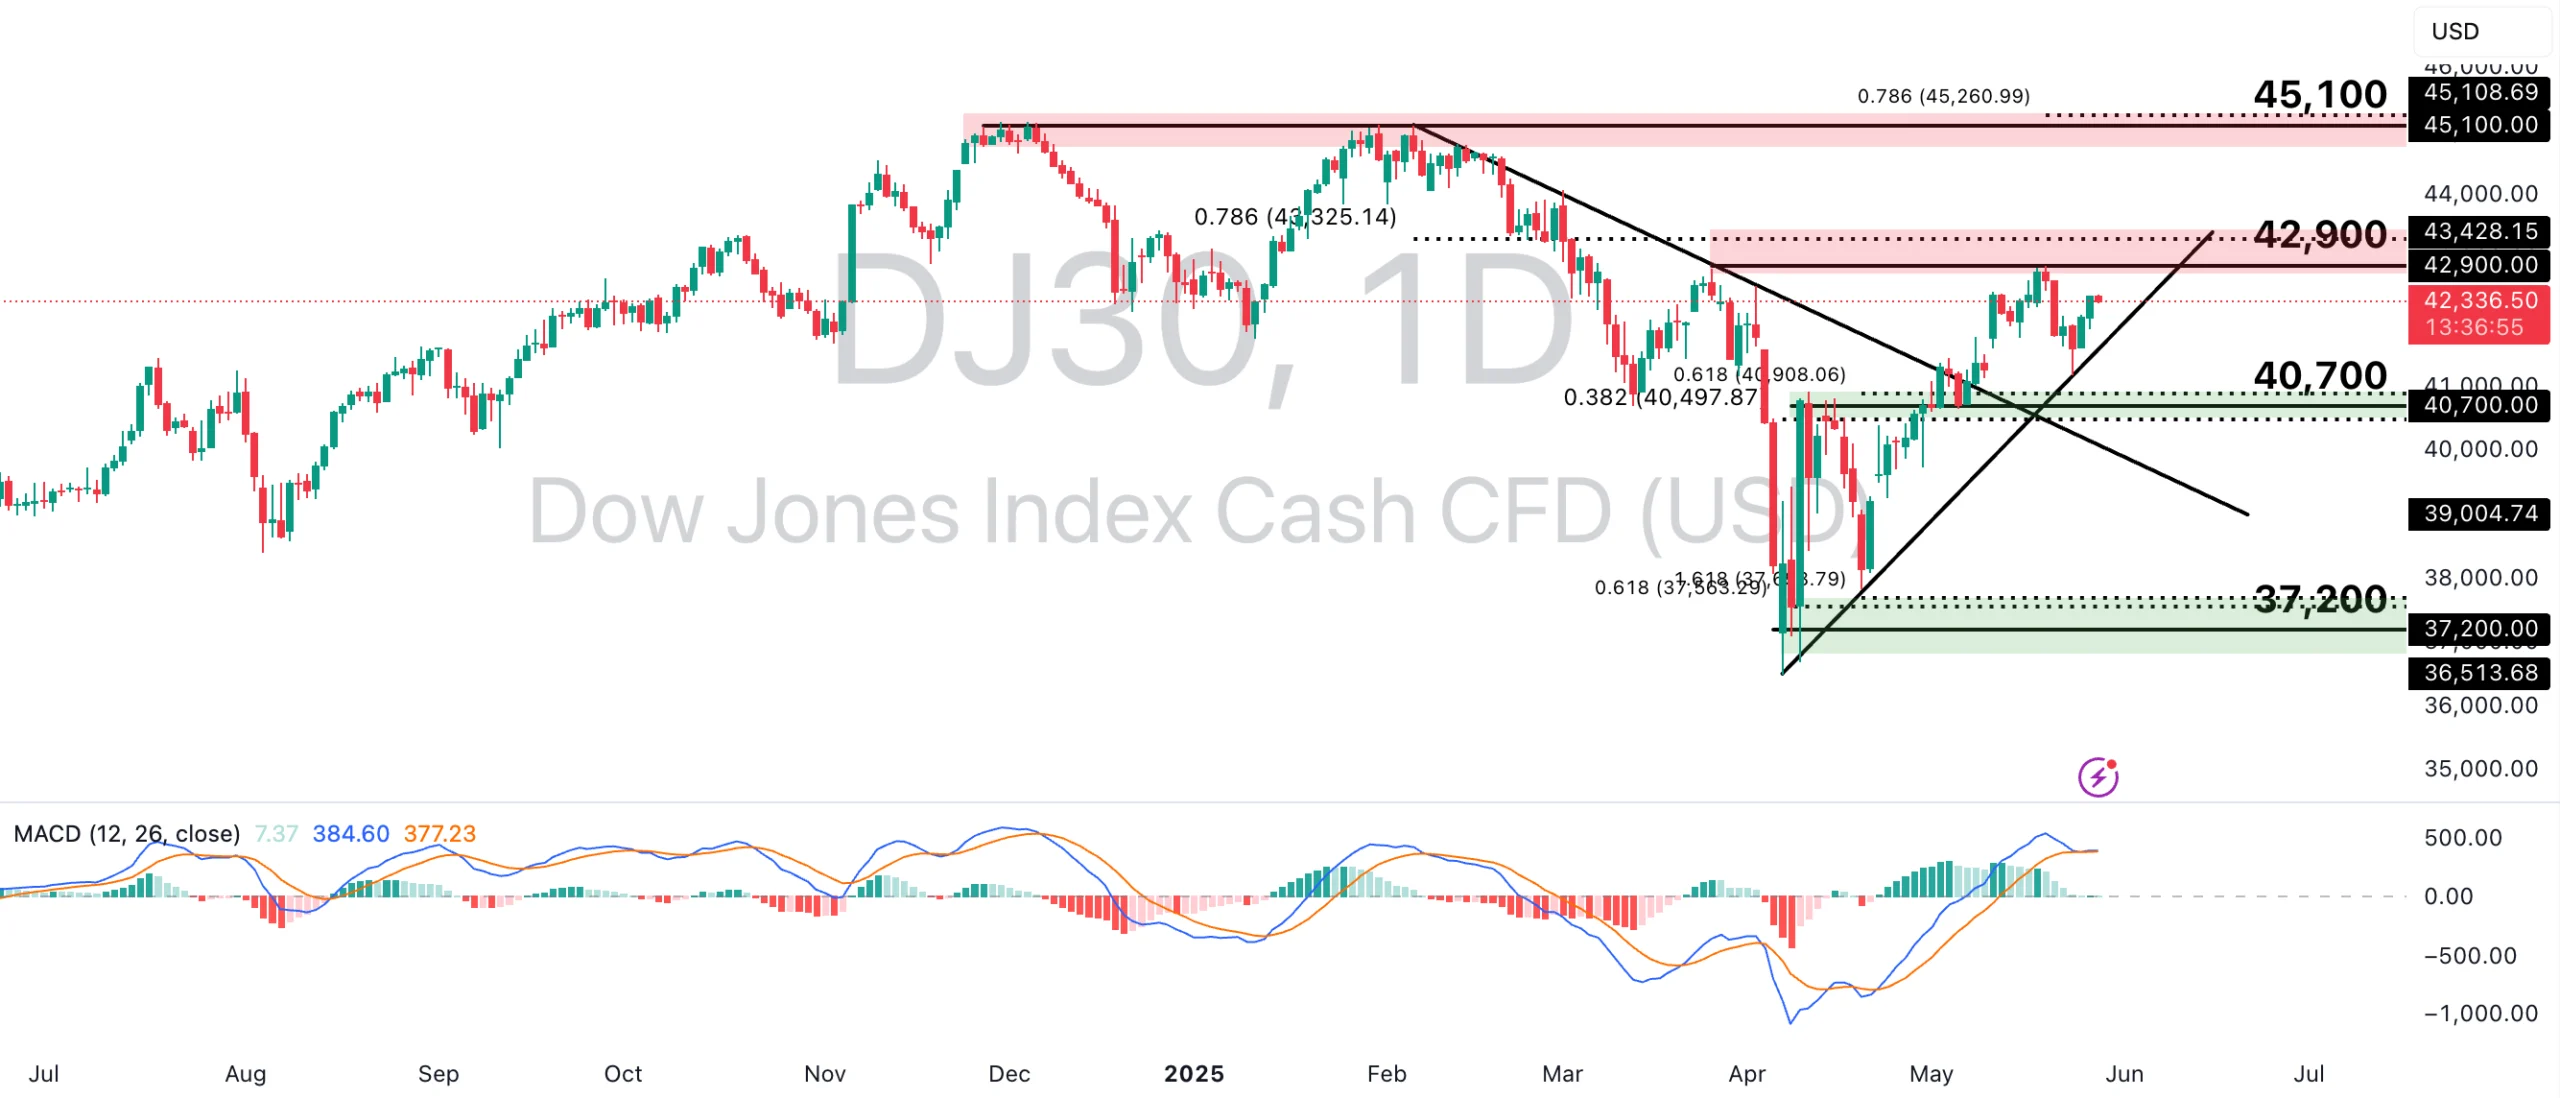
DJ30 has seen a breakout above the descending trendline resistance and is now holding above ascending trendline support as bullish momentum continues. The price is approaching the 42,900-point resistance zone, in line with the 78.6% Fibonacci Retracement level. A convincing break and close above this level could see the price rally towards the 45,100-point swing high resistance, aligned with the 78.6% Fibonacci Extension level.
However, if bullish momentum falters, the price could instead test support zones at the 40,700-point level, in line with the 38.2% Fibonacci Retracement and 61.8% Fibonacci Extension levels, and the 37,200-point swing low support, which corresponds to the 61.8% and 161.8% Fibonacci Extension levels. Although the MACD remains in bullish territory, a potential crossover could suggest a slowdown in its bullish momentum.
S&P 500 – Sustained Recovery, or Shaky at Best?
The S&P 500 remains the most diversified and stable barometer of U.S. economic sentiment. Its rebound from the April 2025 lows suggests improved confidence in the equity market. The CBOE Volatility Index (VIX), also commonly known as the fear index, is hovering near the 20 level, suggesting a relatively calm market environment compared to periods of heightened uncertainty, when the VIX typically spikes well above 20. As risk appetite returns, the S&P 500 could see further gains. However, a sustained rally depends on the earnings results and macroeconomic backdrop.
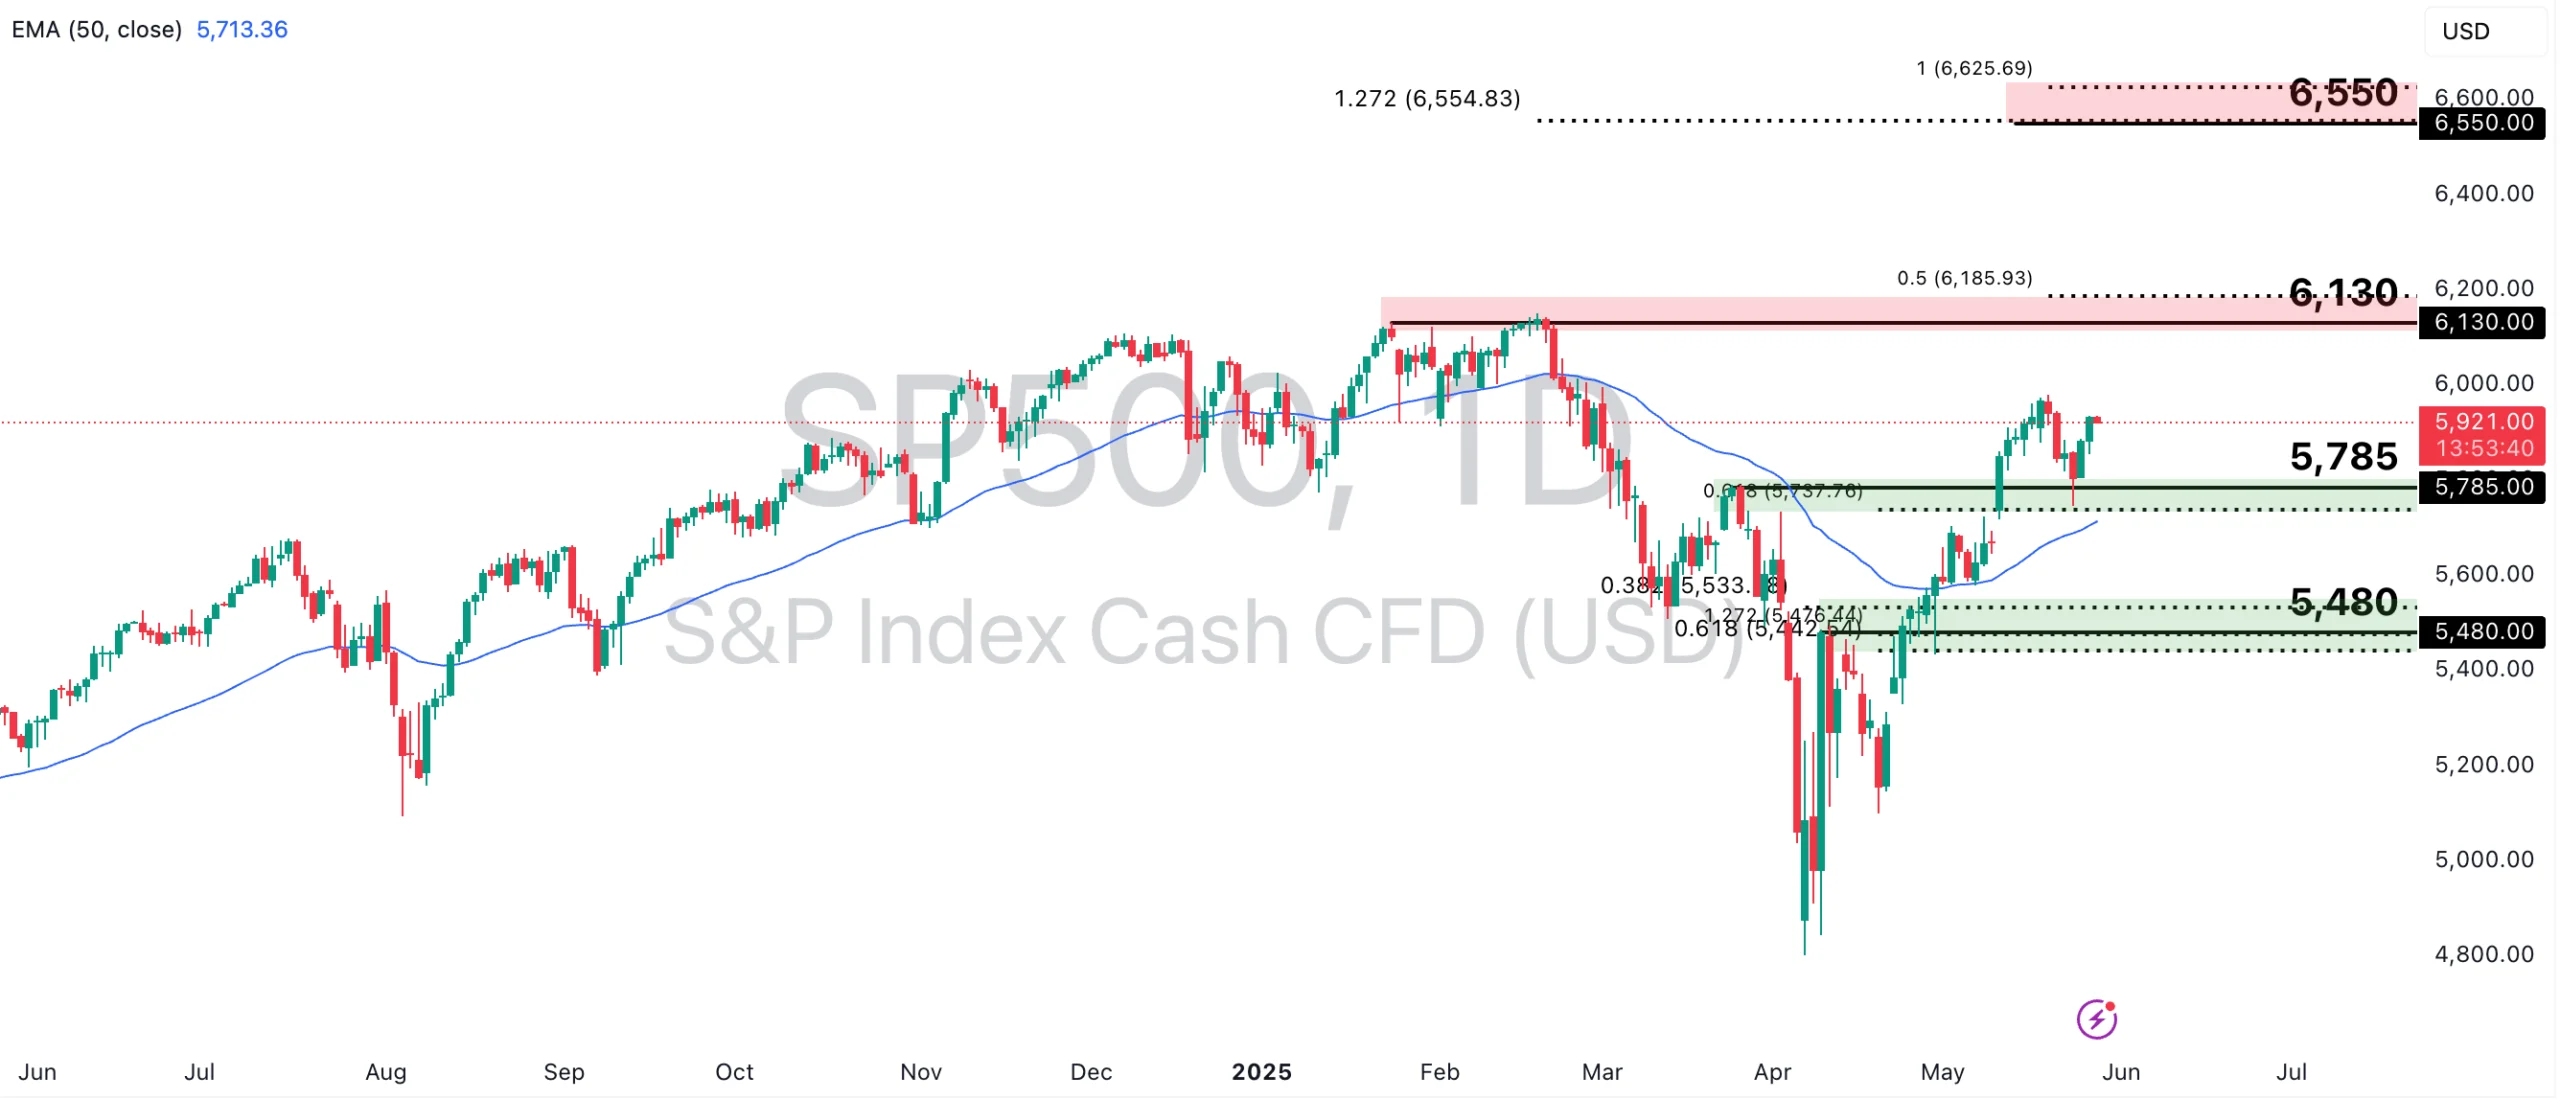
The S&P 500 is currently holding steadily above the Ichimoku cloud and 50-EMA, indicating strong bullish momentum following the trend reversal in April. If this momentum continues, the price could approach the 6,130-point swing high resistance, in line with the 50% Fibonacci Extension level, or potentially rise further towards the 6,550-point resistance, aligned with the 127.2% Fibonacci Retracement and 100% Fibonacci Extension levels.
On the flip side, a deeper retracement could see the price retest the 5,785-point key support level, in line with the 50-EMA and 61.8% Fibonacci Extension level, or fall further to the 5,480-point support zone, which coincides with a broader Fibonacci confluence area.
Traders are understandably optimistic about the rebound in U.S. stock markets, especially after a challenging start to the year. However, caution is warranted, as U.S. trade policy remains unpredictable. While the recent court ruling has dealt a blow to sweeping tariff plans, an appeal is already underway. Concessions can be reversed, and the path ahead remains contingent on key catalysts – corporate earnings, tariff developments, the Fed’s rate path, and upcoming economic data releases, all of which could either reinforce or derail the current bullish narrative.