US Inflation: Soft Landing or Turbulence Ahead?

US inflation is back in the spotlight, especially after Trump’s One Big Beautiful Bill, which is expected to fuel inflation for years to come. Add rising tariff fears, with Trump imposing new tariffs on countries yet to strike deals with the US, and the impact on the US economy remains highly uncertain.
In May, US headline CPI ticked up by just 0.1% MoM, down from April’s 0.2%, while core CPI (excluding food and energy) also increased by 0.1% MoM, holding steady at 2.8% YoY. This mild inflation print had previously reinforced expectations that the Fed would accelerate its path towards further rate cuts. However, the Fed looks to remain data-dependent, holding out on monetary easing despite ongoing pressure from President Trump.
This leaves markets on edge. While inflationary pressures appear to be cooling, Trump’s volatile policies are keeping the Fed from implementing interest rate cuts, which are needed to keep the US economy on track towards recovery. Meanwhile, US assets are feeling the heat: Treasuries and the US dollar have suffered from a systematic rotation out of US assets and renewed interest in hedging against US asset declines.
DXY – The US Dollar’s Ongoing Struggles
The US dollar is stuck in a steady decline, driven by a shift away from US assets and increasing demand for hedges against dollar risk. Nevertheless, the US dollar still holds the crown as the world’s reserve currency because of the lack of a viable alternative. However, unless demand rebounds, the DXY looks set for further declines. Moreover, imminent Fed rate cuts could further erode the attractiveness of the US dollar on a fundamental level.
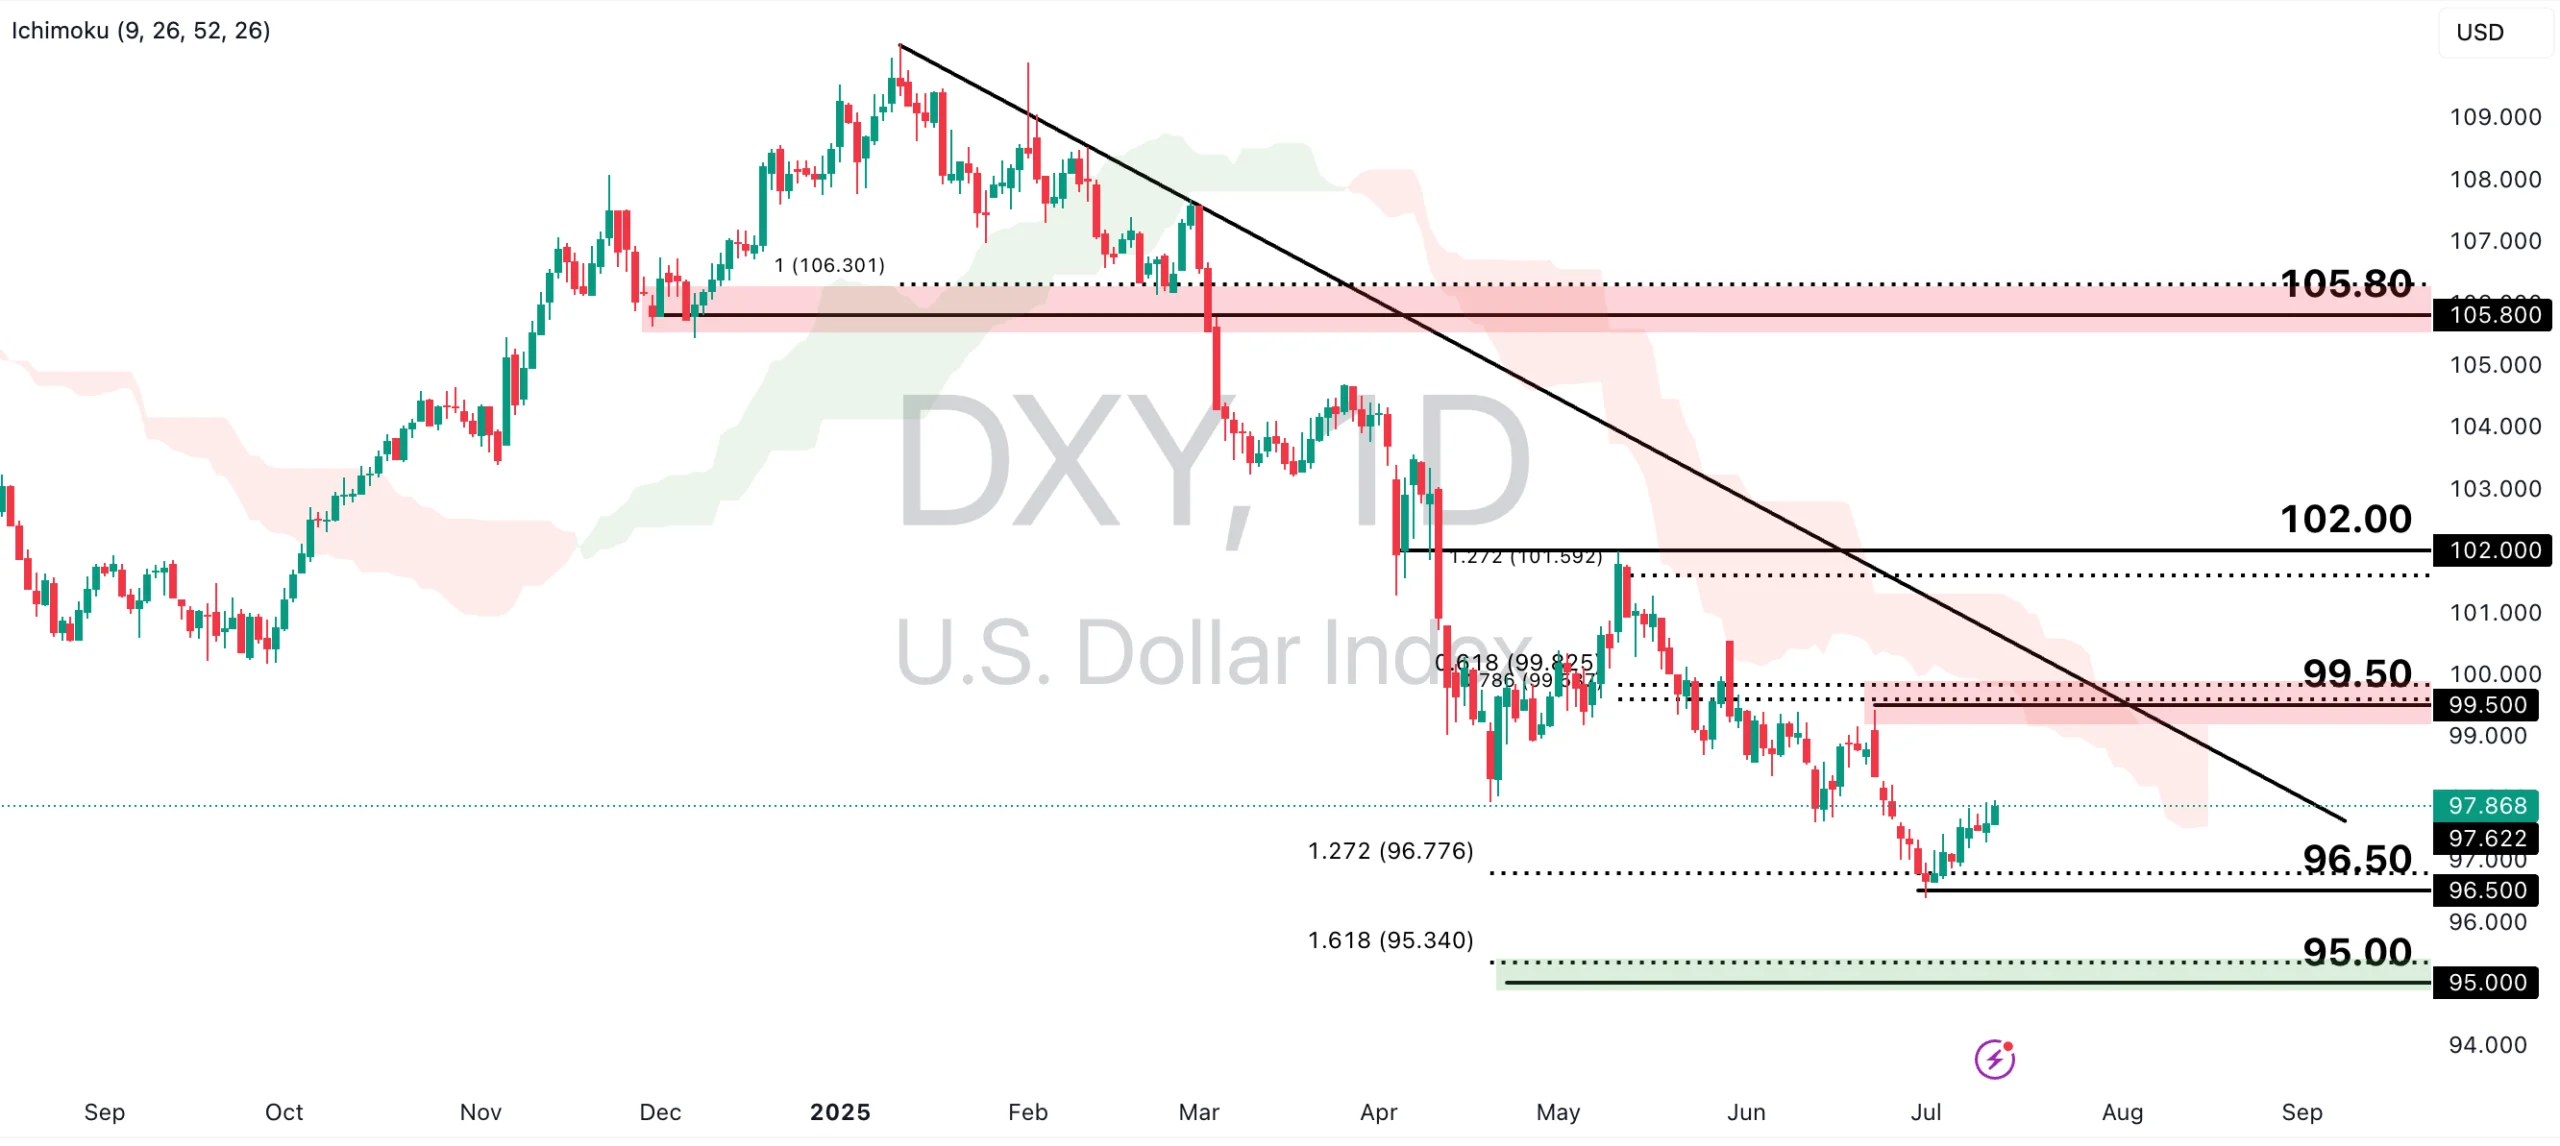
DXY is still under bearish pressure as it holds below both the descending trendline resistance and the Ichimoku cloud. A break below the 96.50 swing low could prompt a further decline toward the next support level at 95.00, which is in line with the 161.8% Fibonacci retracement.
However, a pullback in the price could see it retest the descending trendline resistance at 99.50, in line with an area of strong Fibonacci confluence. Any deeper retracement could mean that bearish pressure may be waning.
XAUUSD: Trading Sideways, but with Bullish Potential
Gold has seen strong demand this year, particularly as an alternative for a store of value by central banks. However, the price is trading sideways now as markets consider whether such demand is sustainable. A return of risk aversion, triggered by Trump’s new wave of tariffs, could reignite gold demand, while renewed inflation fears may boost the appeal of the precious metal as a traditional inflation hedge.
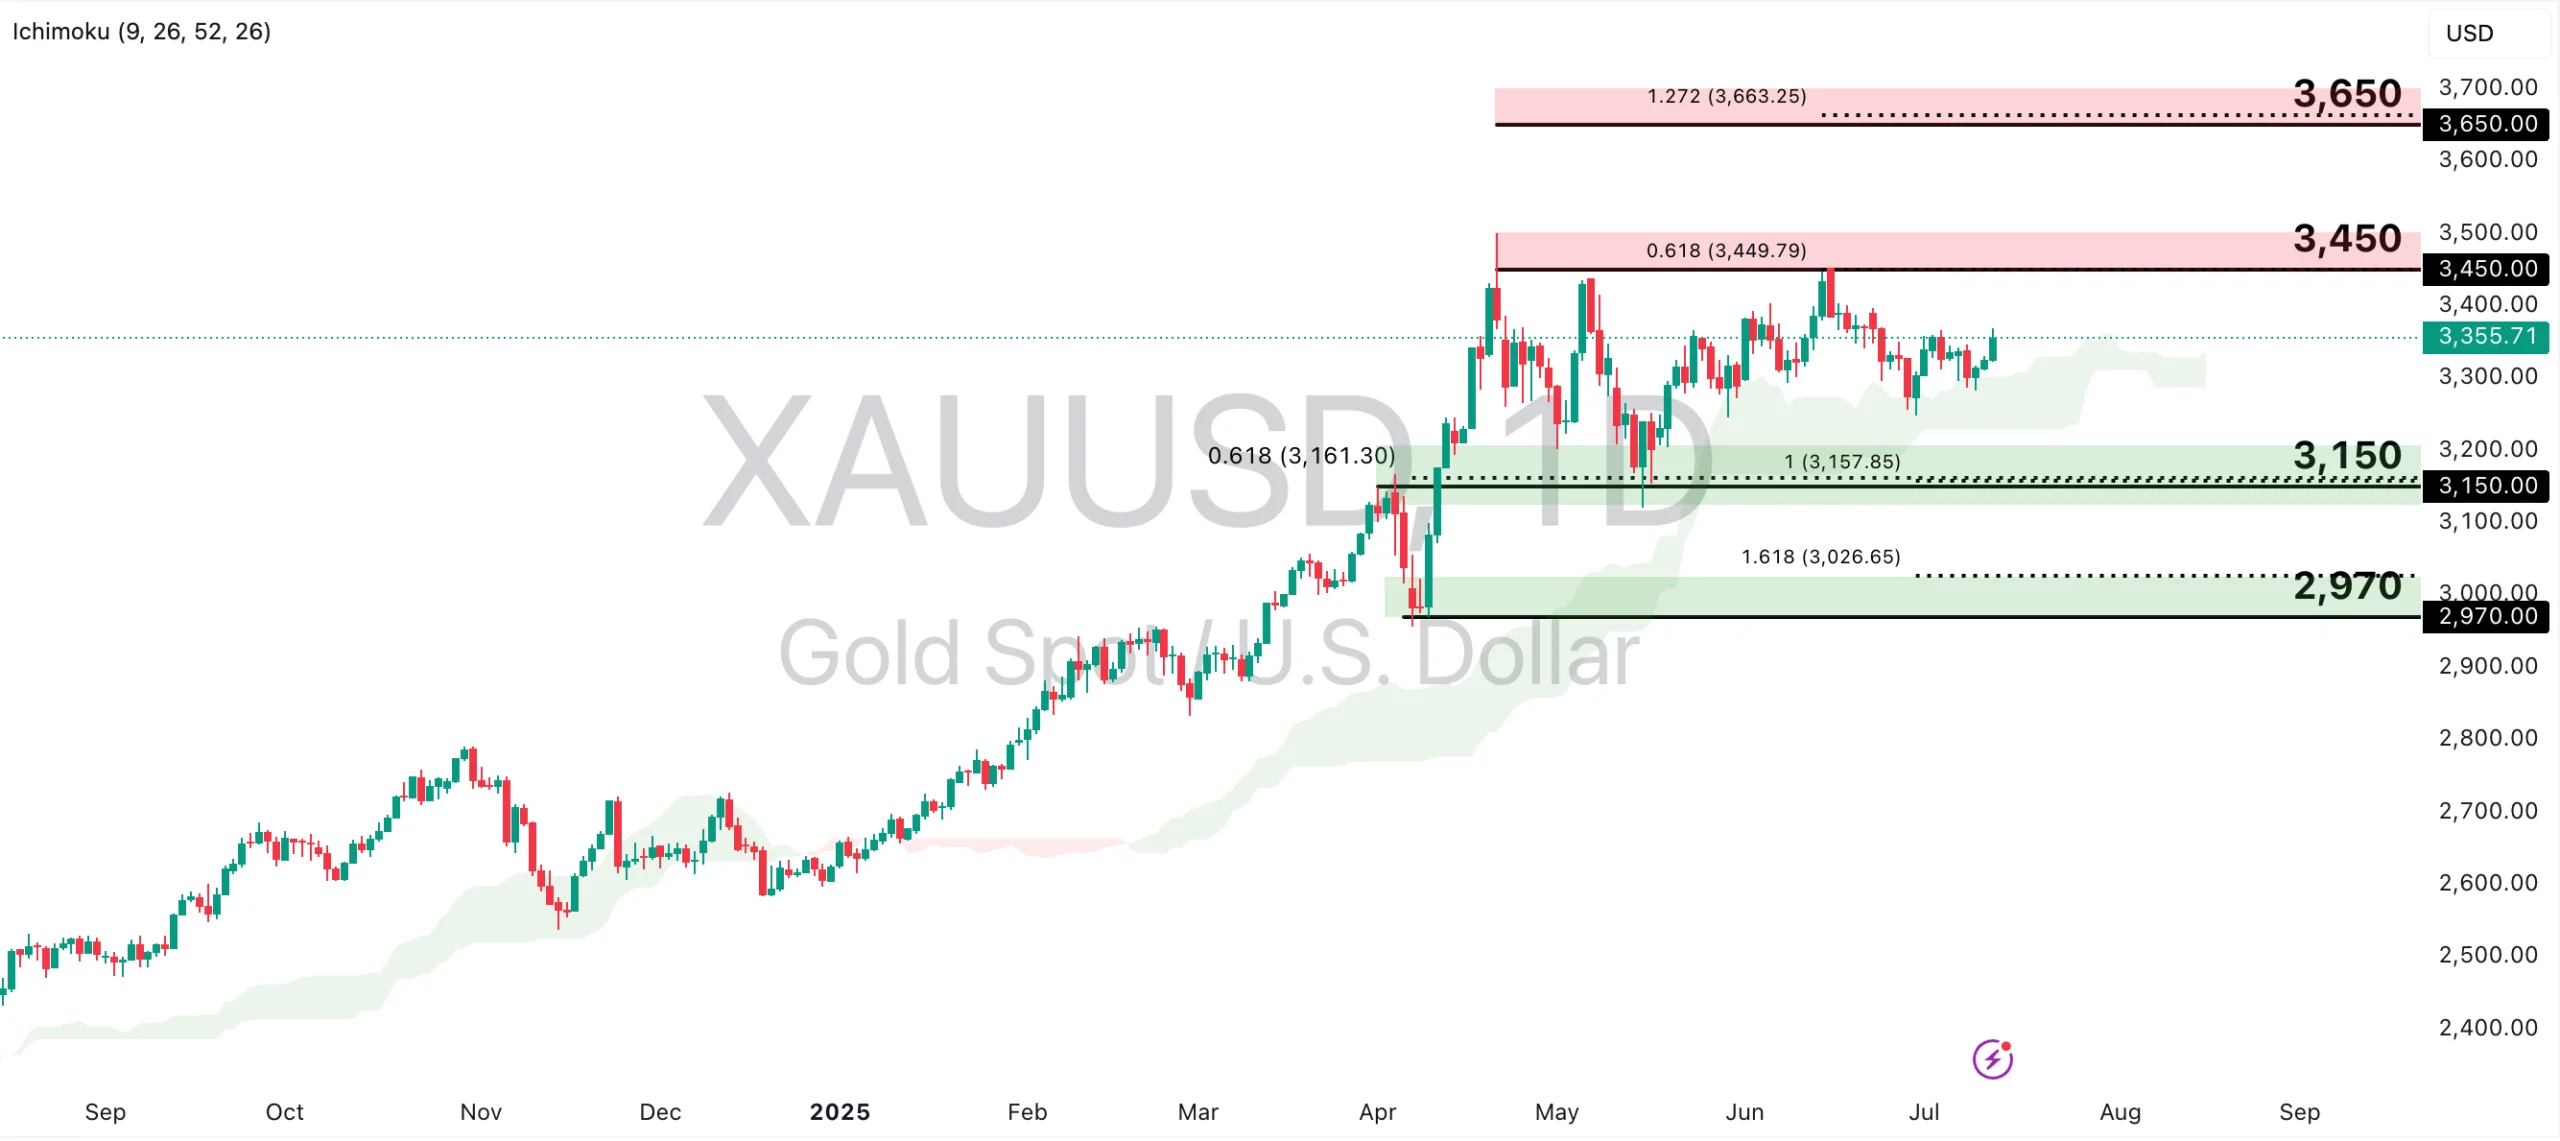
XAUUSD remains above the Ichimoku cloud, suggesting that bullish momentum is still intact. If the uptrend continues, gold prices could hold above the $3,150 support zone, which aligns with the 61.8% Fibonacci Retracement and 100% Fibonacci Extension levels. The price could then retest the $3,450 swing high resistance, which coincides with the 61.8% Fibonacci Extension level. A breakout above $3,450 would open the door to further gains, with $3,650 as the next key resistance.
On the flip side, a throwback could see the price retest the $3,150 support. Any further decline may signal weakening demand for gold. If XAUUSD drops to test the $2,970 swing low support, which is in line with the 161.8% Fibonacci Extension, it will be important to reassess the supply-and-demand dynamics for gold.
Keep an eye out, not just for inflation metrics in the short term, but also for indicators that Trump’s policies are sparking a new bout of inflationary pressures in the medium to long term. This would have a significant impact on key assets like gold and the US dollar.