Weekly Outlook | A correction in the making?

Important events this week:
Last week’s data suggest that the economic development remains positive. In particular the purchasing manager index data (PMI) from the US showed positive momentum, which could help the US stock markets further. On the other hand, the services PMI from Germany showed a decline. Instead of the expected 49.6 the number only came in at 47.2.
In general, geopolitical tensions remain an important topic apart from the data releases this week, whereas the center- stage will still be taken by Trump’s decisions. His actions in regards to the increase in the production of atomic power keep stirring up energy markets. A potential reason why oil pries rose and Uranium gearing up momentum as well.
– NZ interest rate decision– It is expected that the RBNZ will cut interest rates this week, similarly to the RBA last week. A 25-basis points rate cut is currently expected and might cause the NZD to weaken slightly initially. However, as long term charts suggest, the market momentum remains positive and might support the Kiwi further in the hours after the news event.
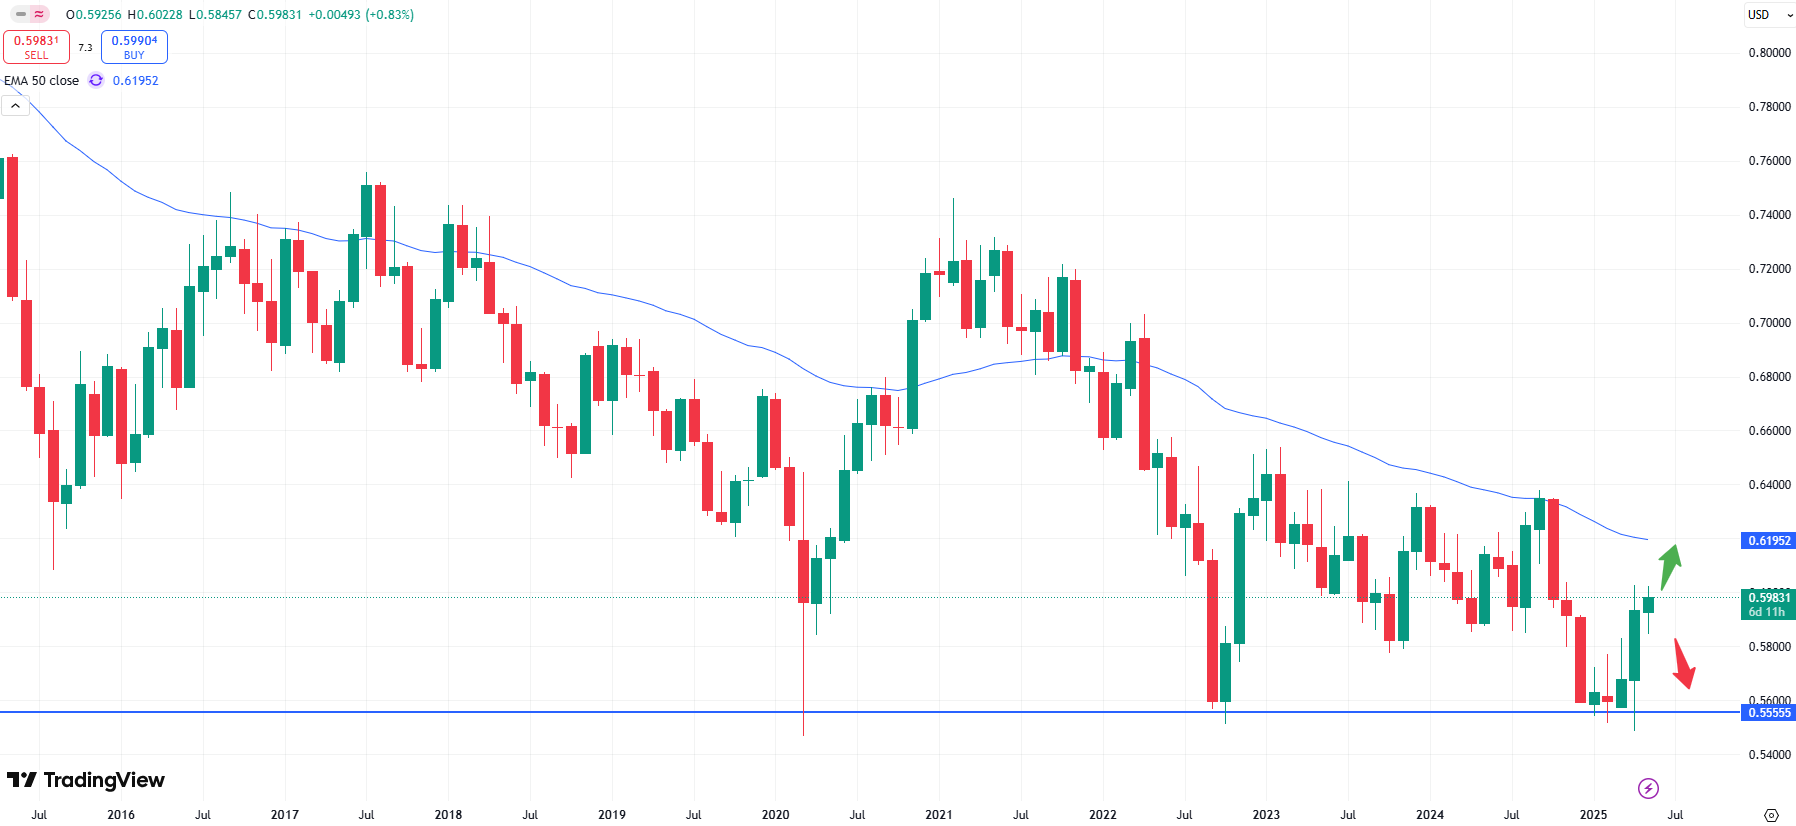
AUDUSD monthly chart
Based on the charting pattern above the positive sentiment might continue. Any retracements lower might be used to enter into fresh positions to the upside. An initial target can be found with the 50- moving average at around the 0.6200 zone. The interest rate decision from New Zealand will take place on the 28th of May, 2025 at 04:00 CET.
– US prelim GDP– Despite the GDP data being rather backward looking, we like to take a look into the release as well. Currently the development of the US economy remains in focus and any deviation of the data might determine the way for the Dollar.
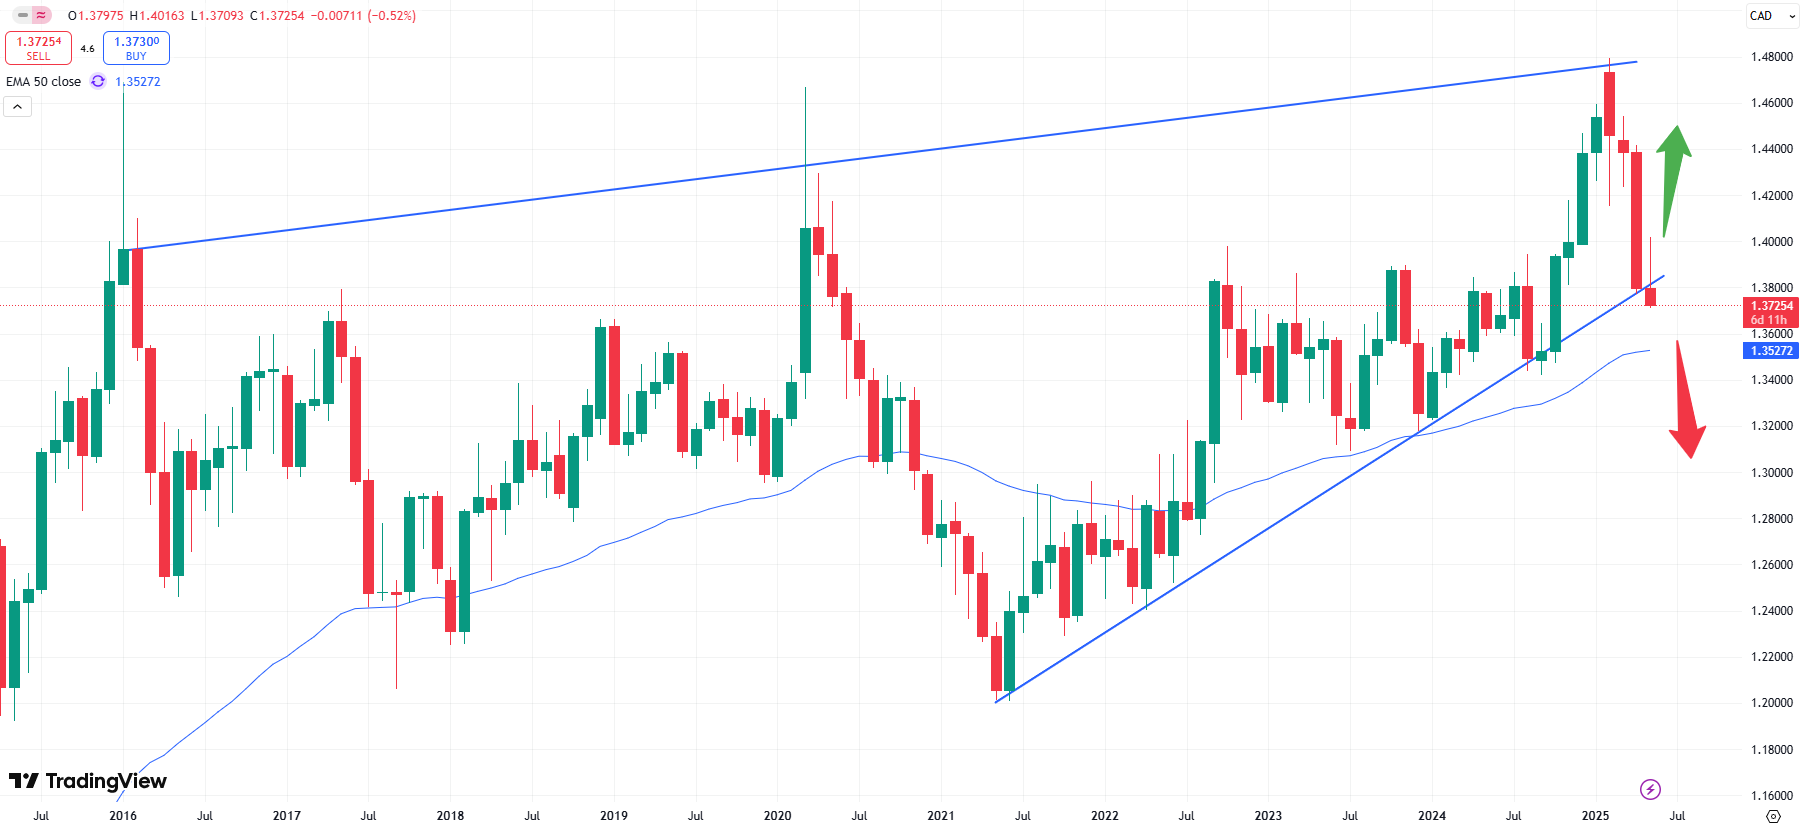
USDCAD monthly chart
As the monthly chart above shows, the Dollar might lose further momentum. Technically the price has already broken to the downside, based on the broken trendline. If the 50- moving average breaks, a further fall in prices might be seen. This could move the market towards the ~1.3350 price range. The data from the US will be released on the 29th of May, 2025 at 14:30 CET.
– US Core PCE Price Index– This week market participants will digest the data from the US, in particular with the core PCE price index. A higher rate might cause the Fed to remain on their current rate path for longer, which could cause harm for the equity market.
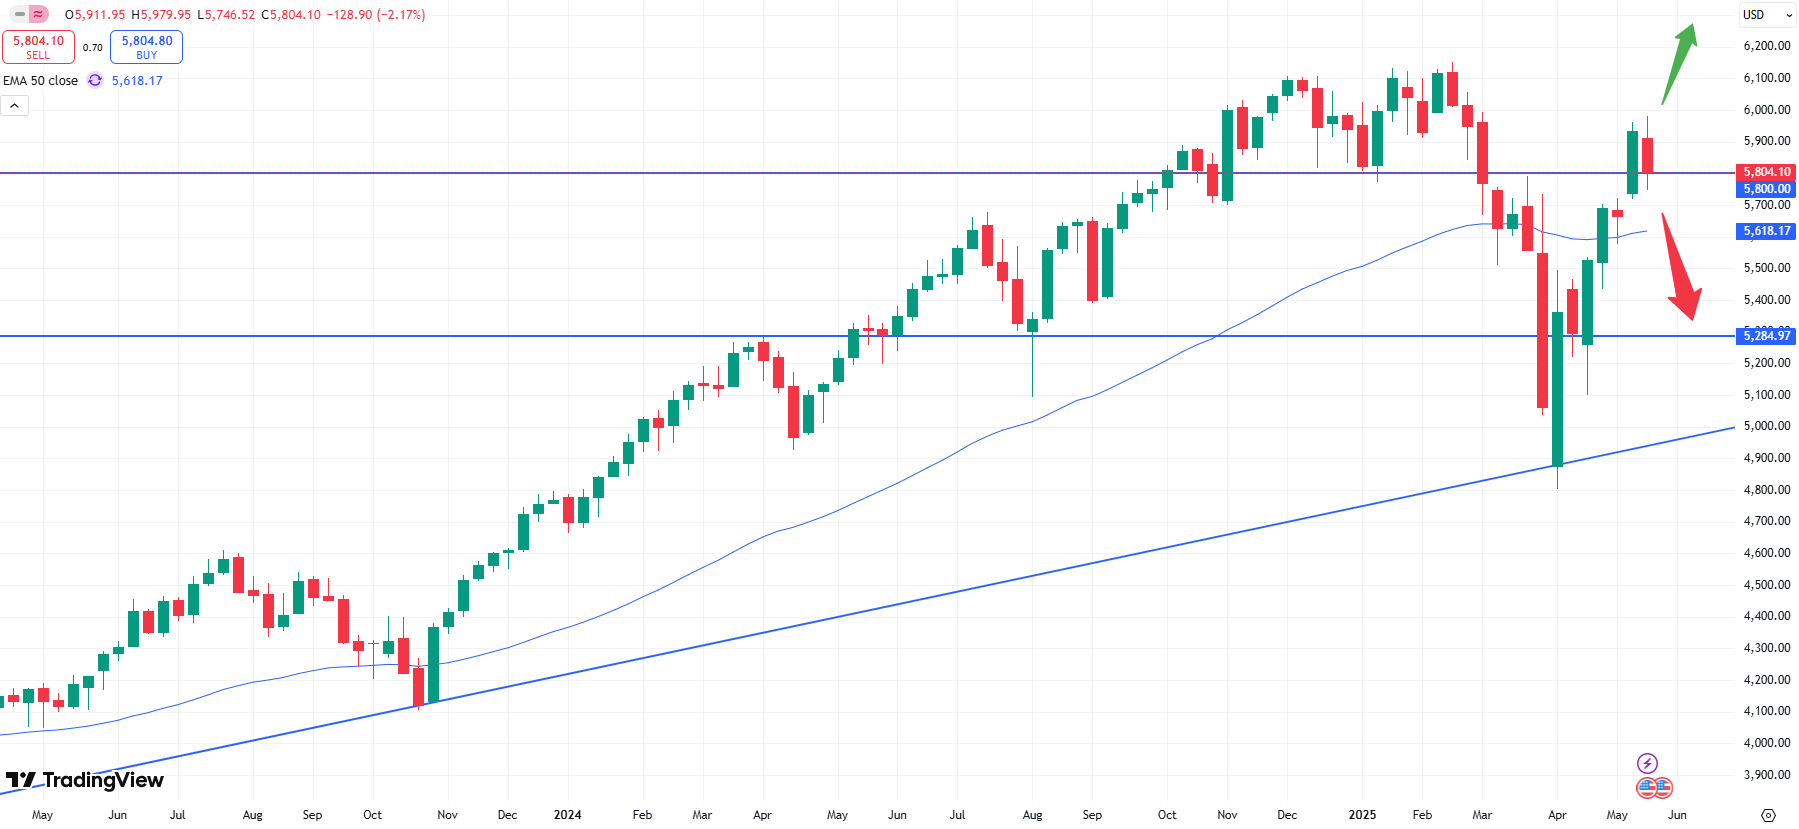
S&P 500 weekly chart
A closer look at the S&P 500 index reveals that the price has started to correct last week. A break of the level of 5,800 might cause an escalation of the downside. This might happen if the PCE index comes in hotter than expected, as the Fed might be expected to remain with their hawkish stand. Else the upside might continue with positive momentum as before. The index from the US will be published on the 30th of May, 2025 at 14:30 CET.